

Standardized ultrasound hepatic/renal ratio and hepatic attenuation rate to quantify liver fat content: an improvement method
- PMID: 22016092
- PMCID: PMC3270296
- DOI: 10.1038/oby.2011.302
Standardized ultrasound hepatic/renal ratio and hepatic attenuation rate to quantify liver fat content: an improvement method
Abstract
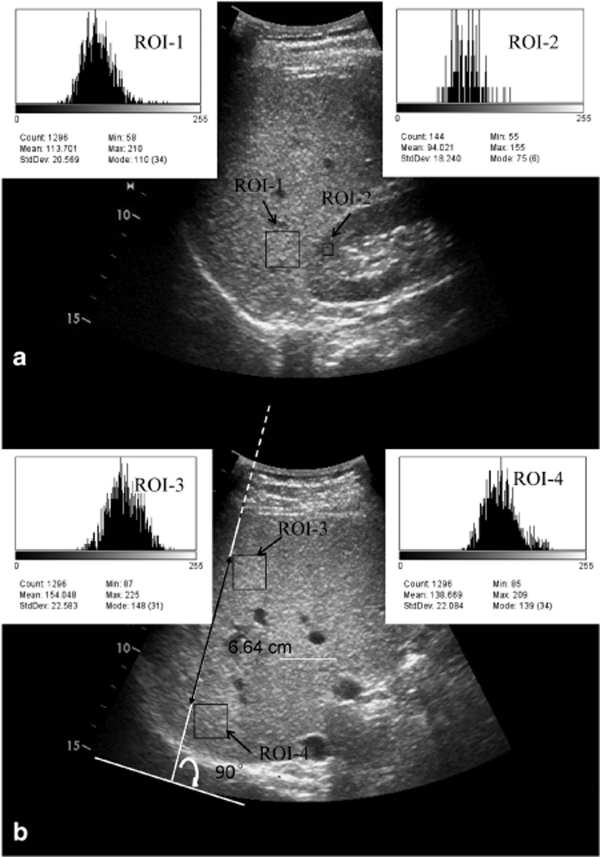
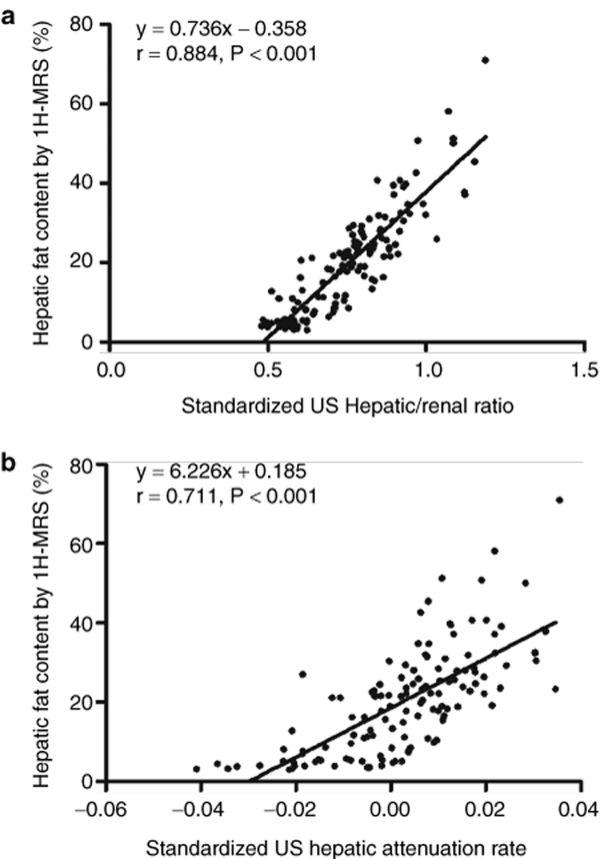
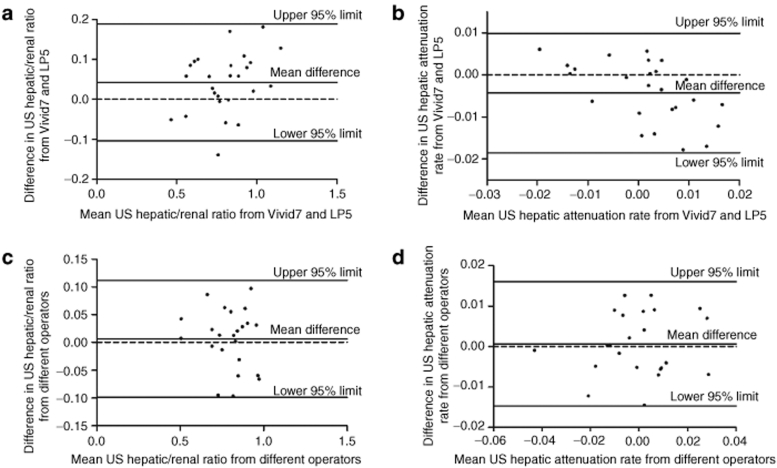
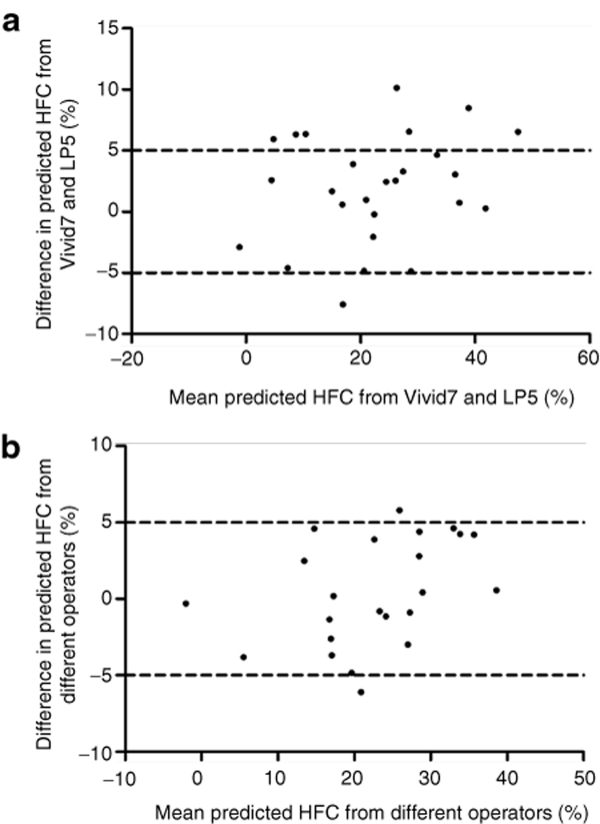
Accurate measures of liver fat content are essential for investigating the role of hepatic steatosis in the pathophysiology of multiple metabolic disorders. No traditional imaging methods can accurately quantify liver fat content. [(1)H]-magnetic resonance spectroscopy (MRS) is restricted in large-scale studies because of the practical and technological issues. Previous attempts on computer-aided ultrasound quantification of liver fat content varied in method, and the ultrasound quantitative parameters measured from different ultrasound machines were hardly comparable. We aimed to establish and validate a simple and propagable method for quantitative assessment of liver fat content based on the combination of standardized ultrasound quantitative parameters, using [(1)H]-MRS as gold standard. Totally 127 participants were examined with both ultrasonography (US) and [(1)H]-MRS. Ultrasound hepatic/renal echo-intensity ratio (H/R) and ultrasound hepatic echo-intensity attenuation rate (HA) were obtained from ordinary ultrasound images using computer program. Both parameters were standardized using a tissue-mimicking phantom before analysis. Standardized ultrasound H/R and HA were positively correlated with the liver fat content by [(1)H]-MRS (r = 0.884, P < 0.001 and r = 0.711, P < 0.001, respectively). Linear regression analysis showed ultrasound H/R could modestly predict the amount of liver fat (adjusted explained variance 78.0%, P < 0.001). The addition of ultrasound HA slightly improved the adjusted explained variance to 79.8%. Difference of estimated liver fat contents between different ultrasound machines and operators was reasonably well. Thus, computer-aided US is a valid method to estimate liver fat content and can be applied extensively after standardization of ultrasound quantitative parameters.
Figures
Similar articles
-
Ultrasonography to quantify hepatic fat content: validation by 1H magnetic resonance spectroscopy.Obesity (Silver Spring). 2009 Dec;17(12):2239-44. doi: 10.1038/oby.2009.154. Epub 2009 May 21. Obesity (Silver Spring). 2009. PMID: 19461588
-
Ultrasound hepatic/renal ratio and hepatic attenuation rate for quantifying liver fat content.World J Gastroenterol. 2014 Dec 21;20(47):17985-92. doi: 10.3748/wjg.v20.i47.17985. World J Gastroenterol. 2014. PMID: 25548498 Free PMC article.
-
Sonographic hepatic-renal ratio as indicator of hepatic steatosis: comparison with (1)H magnetic resonance spectroscopy.Metabolism. 2009 Dec;58(12):1724-30. doi: 10.1016/j.metabol.2009.05.032. Epub 2009 Aug 28. Metabolism. 2009. PMID: 19716568
-
Liver fat content determined by magnetic resonance imaging and spectroscopy.World J Gastroenterol. 2010 Apr 7;16(13):1560-6. doi: 10.3748/wjg.v16.i13.1560. World J Gastroenterol. 2010. PMID: 20355234 Free PMC article. Review.
-
Recent advances in noninvasive assessment of liver steatosis.Pol Arch Intern Med. 2024 Apr 26;134(4):16703. doi: 10.20452/pamw.16703. Epub 2024 Mar 18. Pol Arch Intern Med. 2024. PMID: 38501721 Review.
Cited by
-
Dynamic changes in the distribution of facial and abdominal adipose tissue correlated with surgical treatment in acromegaly.Endocrine. 2018 Dec;62(3):552-559. doi: 10.1007/s12020-018-1742-x. Epub 2018 Sep 10. Endocrine. 2018. PMID: 30203120
-
Hepatic steatosis assessment using ultrasound homodyned-K parametric imaging: the effects of estimators.Quant Imaging Med Surg. 2019 Dec;9(12):1932-1947. doi: 10.21037/qims.2019.08.03. Quant Imaging Med Surg. 2019. PMID: 31929966 Free PMC article.
-
Neck Circumference is an Effective Supplement for Nonalcoholic Fatty Liver Disease Screening in a Community-Based Population.Int J Endocrinol. 2020 May 16;2020:7982107. doi: 10.1155/2020/7982107. eCollection 2020. Int J Endocrinol. 2020. PMID: 32508918 Free PMC article.
-
Non-invasive monitoring of hepatic steatosis via acoustic structure quantification of ultrasonography with MR spectroscopy as the reference standard.Ultrasonography. 2020 Jan;39(1):70-78. doi: 10.14366/usg.19002. Epub 2019 Jun 25. Ultrasonography. 2020. PMID: 31639886 Free PMC article.
-
Effect of resveratrol on non-alcoholic fatty liver disease.Exp Ther Med. 2019 Jul;18(1):559-565. doi: 10.3892/etm.2019.7607. Epub 2019 May 23. Exp Ther Med. 2019. PMID: 31316594 Free PMC article.
References
-
- Clark JM, Brancati FL, Diehl AM. Nonalcoholic fatty liver disease. Gastroenterology. 2002;122:1649–1657. - PubMed
-
- Williams R. Global challenges in liver disease. Hepatology. 2006;44:521–526. - PubMed
-
- Amarapurkar DN, Hashimoto E, Lesmana LA, Asia-Pacific Working Party on NAFLD et al. How common is non-alcoholic fatty liver disease in the Asia-Pacific region and are there local differences. J Gastroenterol Hepatol. 2007;22:788–793. - PubMed
Publication types
MeSH terms
LinkOut - more resources
Full Text Sources
Other Literature Sources
Medical
