Review
. 2012 Feb;40(2):486-506.
doi: 10.1007/s10439-011-0436-9. Epub 2011 Oct 21.

An overview of three promising mechanical, optical, and biochemical engineering approaches to improve selective photothermolysis of refractory port wine stains

Affiliations
Review

An overview of three promising mechanical, optical, and biochemical engineering approaches to improve selective photothermolysis of refractory port wine stains

Guillermo Aguilar et al. Ann Biomed Eng. 2012 Feb.

Abstract

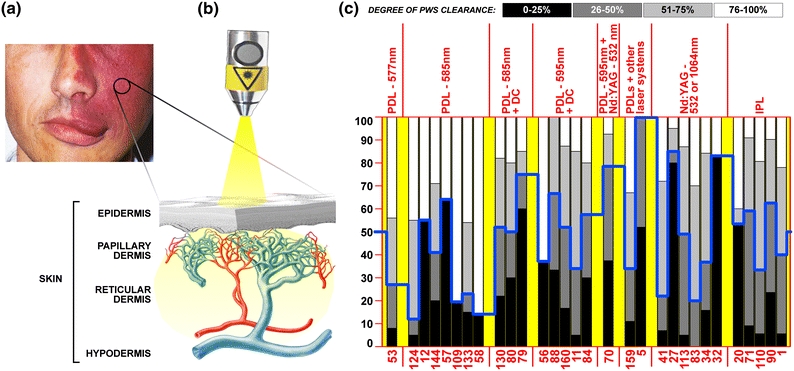
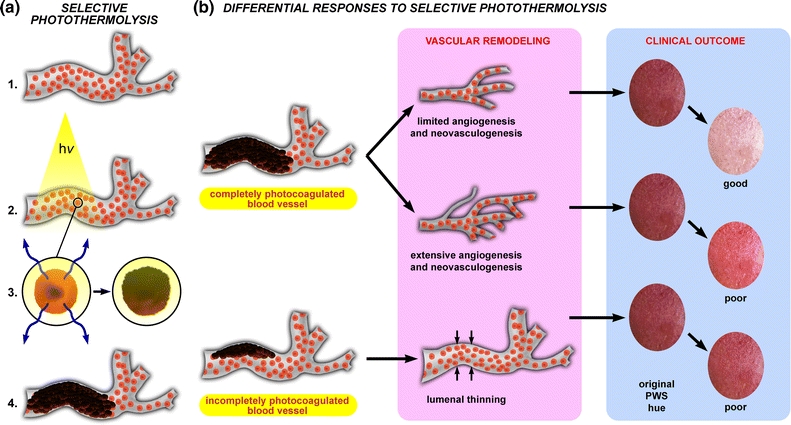
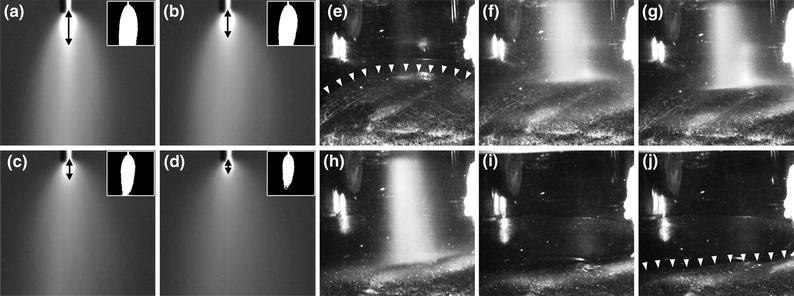
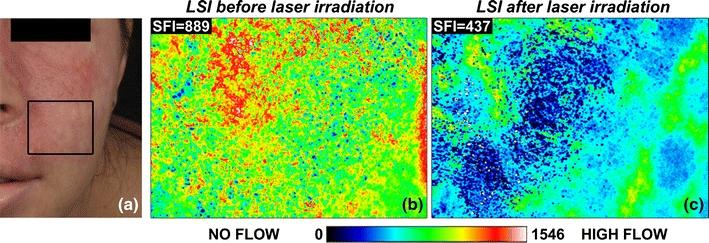
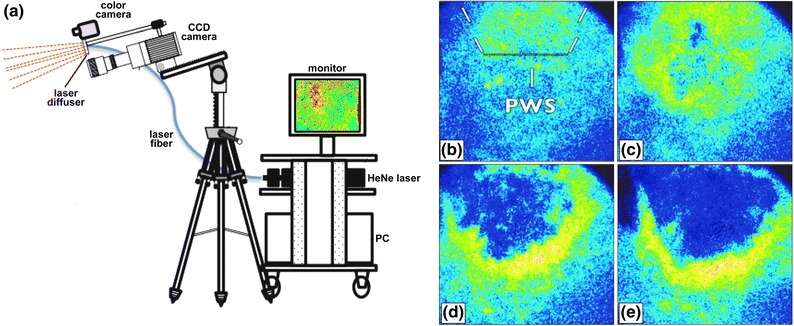
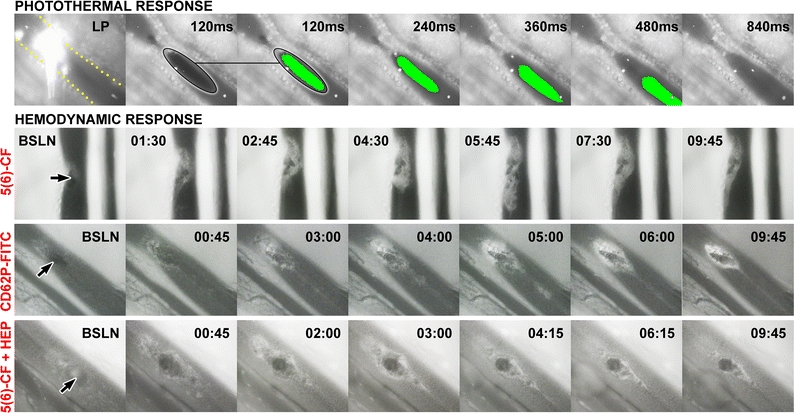
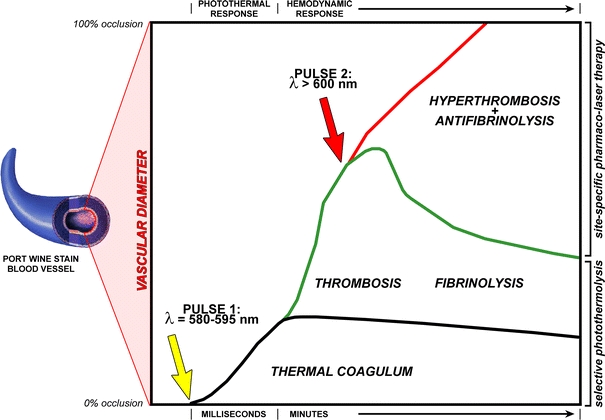
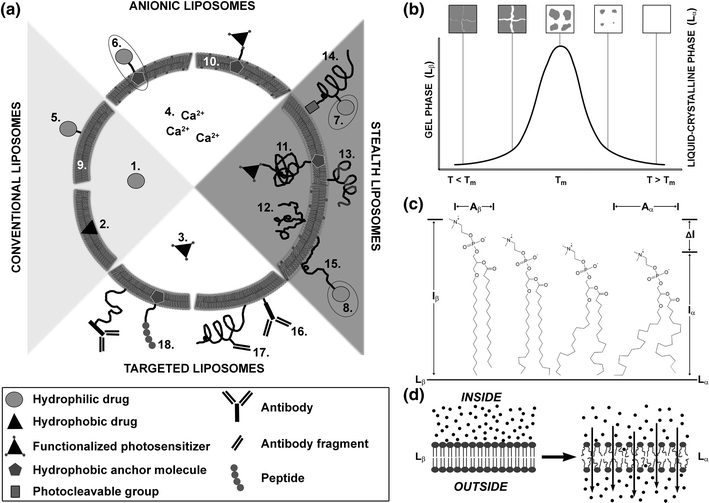
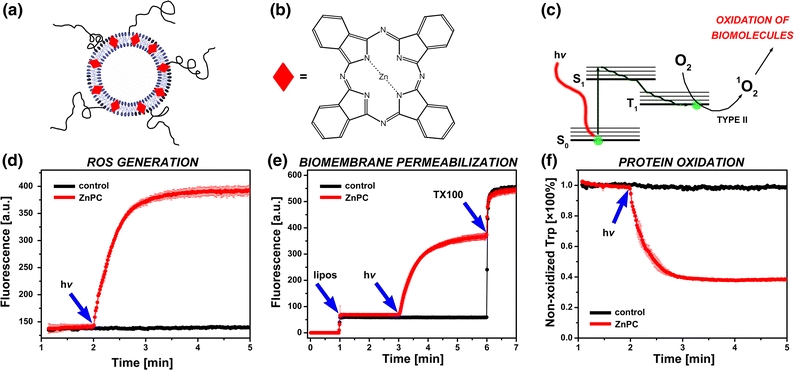
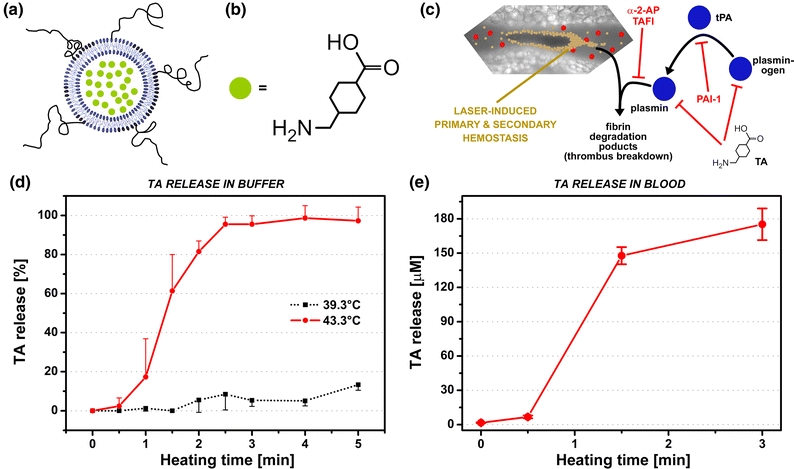
During the last three decades, several laser systems, ancillary technologies, and treatment modalities have been developed for the treatment of port wine stains (PWSs). However, approximately half of the PWS patient population responds suboptimally to laser treatment. Consequently, novel treatment modalities and therapeutic techniques/strategies are required to improve PWS treatment efficacy. This overview therefore focuses on three distinct experimental approaches for the optimization of PWS laser treatment. The approaches are addressed from the perspective of mechanical engineering (the use of local hypobaric pressure to induce vasodilation in the laser-irradiated dermal microcirculation), optical engineering (laser-speckle imaging of post-treatment flow in laser-treated PWS skin), and biochemical engineering (light- and heat-activatable liposomal drug delivery systems to enhance the extent of post-irradiation vascular occlusion).


Figures

Figure 1
Figure 1
(a) Image of a facial PWS, accompanied by soft tissue overgrowth in the mouth area. The encircled portion of the patient’s PWS is enlarged in (b) and presented as a cross section. The various layers of the skin are indicated. The dermis is replete with microcirculation, whereby the arterial segment of the vasculature is depicted in red and the venular segment in blue. Hyperdilation of blood vessels in PWSs prevails predominantly in the venular segment. PWSs are treated non-invasively with lasers (probe), most frequently with pulsed dye lasers (PDLs) in the 577–600 nm range or Nd:YAG lasers (1064 nm or its second harmonic, 532 nm) because of the preferential absorption by hemoglobin. The laser beam significantly diverges in the skin because of scattering. In (c), a summary is provided of clinical studies published between 1990 and 2010, in which the clinical outcome was scored in accordance with the legend (“degree of PWS clearance”). The y-axis indicates the percentage of patients, the x-axis lists the clinical studies by their respective reference. The study outcomes are presented vertically, where each bar represents a grayscale-coded stratum according to the legend. The studies were categorized by laser modality, separated by the vertical red lines and yellow tabs in the chart. The blue line corresponds to the percentage of patients at which the median treatment outcome was reached, i.e., the percentage of patients in which 0–50% clearance (black + dark gray bars) was achieved. This line reflects the treatment efficacy over the sampling period, showing that improvement in PWS therapy is needed and that the degree of lesional clearance does not necessarily depend on the laser modality. Studies with deviant scoring system: references 15, 17, 24 (0–75% clearance = black, 76–100% clearance = white), references 18, 20, and 37 (0–50% clearance = black, 51–100% clearance = white). PDL = pulsed dye laser, DC = dynamic cooling, IPL = intense pulsed light. Image of skin and vascular anatomy courtesy of Ms. Libuše Markvart
Figure 2
Figure 2
(a) Endovascular laser–tissue interactions in relation to SP. When an erythrocyte-filled blood vessel (1, red spheres = erythrocytes) is irradiated with a laser (2, hv) at a wavelength that is predominantly absorbed by hemoglobin in the erythrocyte (3, left panel), the radiant energy is converted to heat (3, blue arrows left panel) that subsequently diffuses away from the erythrocyte. The biomolecules (DNA, proteins, and lipids) in the regions of supracritical heating (>70 °C) undergo thermal denaturation (photocoagulation), as a result of which cells and structures lose their native physicochemical properties (3, right panel). Blood undergoing photocoagulation forms a thermal coagulum—an amorphous clump of damaged and agglutinated erythrocytes and plasma constituents—with which the vascular lumen becomes occluded (4). The extent to which PWS vasculature is photocoagulated during laser treatment essentially dictates the biological response to SP, outlined in (b). The putative contention is that complete photo-occlusion (top pathway) most often results in vascular remodeling characterized by removal of the thermally afflicted vasculature followed by limited angiogenesis and/or neovasculogenesis. These processes typically result in good clinical clearance inasmuch as the dermal blood content is considerably reduced after the vascular remodeling phase (“clinical outcome” panel, illustrating the changes in skin color before (left) and after (right) treatment). Alternatively, when angiogenic/neovasculogenic remodeling following laser treatment is extensive, sufficient reduction in dermal blood volume is hampered and only mild clearance is achieved (middle pathway). In other instances, particularly in refractory PWSs, light penetration is insufficient to induce complete photocoagulation of the vascular lumen, resulting in partial occlusion of the target vessel by a thermal coagulum (bottom pathway). During the remodeling phase, the thermal coagulum is either removed by the reticuloendothelial system or becomes part of the vascular wall, leading to luminal thinning (small opposing arrows). This damage profile is associated with minimal reduction in dermal blood volume and hence poor clinical outcome
Figure 3
Figure 3
(a) An example of a suction cup that is used to induce local hypobaric pressure on the skin. (b) Image of bulk tissue deformation on the forearm of a subject exposed to 34 kPa (247 mmHg) of hypobaric pressure (right panel) and the skin deformation profile as computed by a structural mechanics model at the same hypobaric pressure (left panel). (c) Small-scale numerical model and visible reflectance spectroscopy results reflecting changes in blood flow velocity (BVF) and average vessel diameter (D v) as a function of time during the application of 50-kPa hypobaric pressure on the palm of a 24-year-old male. Data modified from Aguilar et al. (d) Numerical analysis of temperatures (y-axis) generated at the end of a laser pulse (585-nm wavelength, 0.45-ms pulse duration, 1-J/cm2 radiant exposure, 10-mm spot size) at different dermal depths (x-axis) in Fitzpatrick type II skin, plotted for increasing local hypobaric pressures. A 10-μm-diameter blood vessel was positioned at 200 μm below the skin surface. Data taken from Franco et al. Differences in blood (e) and vessel wall temperatures (f) at the end of the laser pulse (585-nm wavelength, 0.45-ms pulse duration, 1-J/cm2 radiant exposure, 10-mm spot size) at hypobaric and atmospheric pressures, plotted as a function of vessel diameter for different vessel depths (legend). Fitzpatrick skin type 2 was modeled. Data taken from Franco et al.
Figure 4
Figure 4
(a) Pressure–temperature (P–T) diagram for 1,1,1,2-tetrafluoroethane (R134a), showing reduced saturation (i.e., evaporation) temperatures with increasing hypobaric pressure (designated in mmHg and indicated in light gray). AP = atmospheric pressure. (b) Skin phantom surface temperatures as a function of time after initiation of a CSC spurt for 0 (AP), 127, 254, 381, and 508 mmHg of hypobaric pressure. (c) Skin phantom surface heat removal as a function of time for 0 (AP), 127, 254, 381, and 508 mmHg of hypobaric pressure. Q = total heat extraction
Figure 5
Figure 5
Isolated video frames of CSC spurts released within a vacuum chamber under atmospheric pressure (a, 760 mmHg) and at 254 (b), 381 (c), and 508 mmHg (d) of hypobaric pressure. The frames were isolated at 100 ms into a 1-s CSC spurt. Arrows indicate approximate jet length based on the region of intense light reflection. The inserts are representations of droplet distribution for the respective CSC spurt. The images in panels (a–d) were converted to binary images and a grayscale intensity threshold cutoff of 85 was used to eliminate pixels with an intensity of 0–84. Accordingly, CSC spurts with a high droplet density (i.e., in a compact cloud) exhibit more reflection and thus a higher grayscale value. CSC spurts with a low droplet density (i.e., in a diffuse cloud) have a lower reflection and thus a lower grayscale value. The generated clouds in the inserts therefore provide an indication on the diffuseness or droplet distribution of a CSC spurt. Data modified from Aguilar et al. The next set of experiments (e–j) was performed on the skin of a healthy volunteer, showing frames from a CSC spray impingement video that corresponds to 0 (e), 32 (f), 64 (g), 100 (h), 128 (i), and 160 ms (j) during and after a 100-ms spurt at 254 mmHg hypobaric pressure. The distance between the nozzle and the skin was 20 mm. The arrowheads in (e) and (j) indicate the transition from a concave to flat skin surface before and after the CSC spurt, respectively. Data modified from Aguilar et al.
Figure 6
Figure 6
The local speckle contrast changes due to scatterer motion. A 633-nm HeNe laser was used to irradiate two identical white silicone blocks (the black vertical rectangle is the gap between the two blocks). (a) When both blocks are stationary, a speckle pattern is visualized for both blocks. (b) When the left block is manually moved, the speckles become blurred, which concurs with a reduction in speckle contrast (K). The lower the value of K, the higher the degree of scatterer motion (i.e., flow when employed on the skin, where erythrocytes comprise the scatterers)
Figure 7
Figure 7
(a) Cross-polarized color image of a patient with a faint PWS. The black rectangle delineates the region imaged with LSI. SFI maps, which indicate relative flow velocities according to the indexed color (scale bar), were collected before (b) and 40 min after completion of laser treatment with a 595-nm pulsed dye laser. Some of the regions that had been irradiated exhibited persistent perfusion, indicating incomplete photocoagulation of the PWS vasculature. Images adapted from Huang et al.
Figure 8
Figure 8
(a) Schematic representation of the second-generation LSI instrument currently in use in the operating room during laser surgery of PWSs. SFI images were extracted from a real-time video feed taken before (b) and at various stages during laser surgery of a PWS: (c) after completion of alexandrite laser therapy, (d) after one pass of a 595-nm pulsed dye laser, (e) after a subsequent pass of the 595-nm pulsed dye laser
Figure 9
Figure 9
The photothermal and hemodynamic responses studied in hamster dorsal skin fold venules., The venules, delineated by yellow dots in the upper left panel, were irradiated with a frequency-doubled Nd:YAG laser (532 nm, radiant exposure of 289 J/cm2, 30-ms pulse duration, and a spot size of 2.3 × 10−3 mm2) to generate subocclusive thermal coagula. Endovascular events were imaged by intravital fluorescence microscopy in combination with brightfield microscopy (photothermal response only). The photothermal response (top row) encompassed the formation of a thermal coagulum (encircled) that remained attached (not shown) or dislodged at the site of laser irradiation. The thermal coagulum was imaged in time, indicated in the upper right corner. Thermal coagula were given a pseudocolor from the third panel onward for better visualization, obtained by intensity thresholding. The second and third panels from the left are identical to demonstrate the accuracy with which the thermal coagula were contoured. Fluorescent microspheres (bright dots in the venule) were infused to monitor blood flow. Venular occlusion was never achieved at these laser parameters, corresponding to the endovascular damage profile in refractory PWS vessels. The hemodynamic response was studied following fluorescent labeling of platelets with 5(6)-carboxyfluorescein (5(6)-CF) in vivo and after laser irradiation (baseline, BSLN). The time after laser irradiation is provided in the upper left or right corner (min:s), and the thermal coagulum is indicated by the arrow. Thrombosis, which encompassed platelet aggregation at and around the thermal coagulum, was characterized by a growth phase (BSLN—06:15) and a subsequent deterioration phase (06:15–15:00). It was further shown that the aggregating platelets become activated, as evidenced by the positive staining with fluorescently labeled anti-CD62P (P-selectin) antibodies, an activation-dependent epitope on platelets and endothelial cells (“CD62P-FITC” row). Moreover, the involvement of the coagulation cascade was confirmed in experiments in which platelets were stained with 5(6)-CF and heparin, an inhibitor of coagulation, was co-infused (“5(6)-CF + HEP” row). The presence of heparin reduced the mean maximum lesional size by 51% and significantly reduced the duration of the thrombus growth phase
Figure 10
Figure 10
Mechanistic illustration of the envisaged treatment modality. A PWS blood vessel is depicted on the left and the y-axis represents its vascular diameter. The bottom of the y-axis indicates 0% occlusion, the top of the y-axis represents 100% occlusion. The x-axis represents time, which is divided in a photothermal response time frame (i.e., laser irradiation) and a hemodynamic response time frame (thrombosis and fibrinolysis). When a patient with a recalcitrant PWS is treated with a laser (pulse 1, yellow arrow), the blood vessel is only partially occluded by photocoagulated blood (thermal coagulum, black line). The laser irradiation triggers thrombosis (green upward line), which extends the degree of vascular occlusion, but not to the level of complete occlusion. Moreover, in time the thrombus breaks down because of enzymatic deterioration (fibrinolysis, green downward line). In case of site-specific pharmaco-laser therapy, photoactivatable nanoparticulate drug delivery carriers are infused into the patient that contain pharmaceutical agents to promote thrombus growth and inhibit thrombus breakdown. Once these drug carriers have accumulated in the thrombus after the first laser pulse, a second laser pulse (pulse 2, red arrow) is used to induce drug release and subsequent pharmacological augmentation of thrombosis and deterrence of fibrinolysis (hyperthrombosis + antifibrinolysis, green line). The extent of hyperthrombosis and antifibrinolysis is exacerbated to such a degree that the entire blood vessel becomes occluded, marking the therapeutic endpoint (i.e., good clearance)
Figure 11
Figure 11
(a) Generic scheme of possible liposomal formulations for site-specific pharmaco-laser therapy. Liposomes are nanoscopic fat droplets that consist of a bilayer of phospholipids and an inner aqueous compartment. The possible liposomal formulations can be divided into four main categories: conventional liposomes, anionic liposomes, sterically stabilized liposomes, and targeted liposomes. Each main category may encompass any of the following subcategories: (I) types of drugs: 1. hydrophilic drugs (e.g., tranexamic acid); 2. hydrophobic drugs (e.g., photosensitizers); 3. functionalized hydrophobic drugs (e.g., functionalized photosensitizers); 4. ions (e.g., calcium); (II) drug grafting methods: 5. (covalent) attachment to a component (phospho)lipid; 6. (covalent) attachment to an anchor molecule (e.g., cholesterol); 7. (covalent) attachment to a polymer side chain (e.g., polyethylene glycol, PEG); 8. (covalent) attachment to a functionalized distal end of a polymer; (III) membrane composition: 9. phosphatidylcholines; 10. phosphatidylcholines with a molar fraction of anionic/cationic (phospho)lipids; (IV) methods of steric stabilization: 11. single chain polymer (e.g., polyethylene glycol, PEG); 12. multichain polymer; 13. multiblock copolymer (e.g., di- or triblock copolymers); 14. photocleavable polymers (e.g., PEGylated plasmalogens); 15. adsorbable polymers (onto anionic/cationic membrane surface); (V) methods of targeting: 16. antibodies; 17. antibody fragments (e.g., Fab’ fragments); and 18. peptides. The main categories are not mutually exclusive; e.g., sterically stabilized liposomes may contain anionic membrane constituents as well as antibodies for targeting. (b) The gel-to-liquid crystalline phase transition of a lipid bilayer. Lipid bilayers principally exist in a gel phase (L β) at temperatures (T) below phase transition temperature (T m) and in a liquid crystalline phase (L α) at T > T m, depicted on the x-axis. Lipid packing is highly ordered in L β and somewhat disordered in L α, accounting for the high and lower degree of membrane impermeability, respectively. The maximum in several physical properties and characteristics, such as (all on y-axis) specific heat, membrane permeability, and interphase boundary (between the melted liquid phase and still solid gel phase) are all at a maximum at T m, and define T m. During heating, grain boundaries arise in the bilayer that demarcate lipid domains in L β and L α (gray and white areas in top panels, respectively). The L βL α interface is characterized by lipid packing defects that impose significant membrane permeability during which the release of liposome-encapsulated molecules becomes possible. Figure partially adapted from Needham et al. (c) Diagram of dipalmitoyl phosphocholine (16:0) in L β (left molecule) transiting to L α (right molecule). The horizontal solid line marks the midplane of the bilayer. The figure is a superimposable representation at the molecular level of the thermogram/phase diagram in (b). The hydrocarbon chains of the L β phospholipid are in an all-trans state before T m. Following phase transition into L α, the hydrocarbon chains exhibit considerable rotameric disorder that is characteristic of linear alkyl chains at T > T m. The thinning of the membrane is shown by ΔI = I b − I a , and the molecular areas A β (gel phase) and A α (liquid crystalline phase) are indicated, all contributing to the increased permeability of the bilayer and corollary release (d, arrows) of encapsulated molecules (d, black spheres). (c) Adapted from Nagle JF.
Figure 12
Figure 12
(a) Model liposomal DDS for prothrombotic site-specific pharmaco-laser therapy, consisting of phosphatidylcholine lipids, cholesterol, and a molar fraction of phosphatidylethanolamine-conjugated PEG. The PEG can be used to conjugate antibodies for immunotargeting to the laser-induced thrombus via e.g., P-selectin or fibrin. The liposomes encapsulate a second generation photosensitizer, zinc phthalocyanine (ZnPC, red diamonds), in the lipid bilayer. The chemical structure of ZnPC is provided in (b). (c) ZnPC is activated by irradiation with resonant light (absorption maximum at 674 nm), causing electrons to transit from the ground (S0) to the first excited state (S1) and subsequently to the triplet state (T1). The photodynamic effect proceeds from the T1 state via energy transfer (type II) to molecular oxygen, yielding the highly cytotoxic and thrombogenic singlet oxygen (1O2), a ROS. The generation of ROS is shown in (d), where ZnPC-encapsulating liposomes composed of 1,2-dipalmitoyl-sn-glycero-3-phosphocholine (DPPC, 66 mol%), cholesterol (30 mol%), and 1,2-distearoyl-sn-glycero-3-phosphoethanolamine-PEG (DSPE-PEG, 4 mol%) were suspended in buffer containing protonated dichlorofluorescein (DCFH2), a probe that becomes highly fluorescent upon oxidation (DCFH2 → DCF, λex = 500 ± 5 nm, λem = 522 ± 5 nm). The liposome suspension was irradiated with a 670-nm solid-state diode laser (hv, blue arrow) to activate ZnPC. The formation of DCF was monitored by fluorescence spectroscopy in time-based acquisition mode. Oxidation of DCFH2 occurred immediately upon laser irradiation of ZnPC-liposomes (red trace, ZnPC:lipid ratio of 0.004), as evidenced by the increase in DCF fluorescence at 522 nm. Irradiation of ZnPC-lacking liposomes (control, black trace) did not result in the generation of ROS and thus DCF fluorescence. In (e), a similar setup was used as in (d) to demonstrate ROS-mediated membrane disruption in cell phantoms composed of DPPC (39 mol%), distearoylphosphocholine (10 mol%), cholesterol (20 mol%), dipalmitoylphosphoserine (20 mol%), dioleoylphosphocholine (5 mol%), 1-stearoyl-2-docosahexaenoylphosphocholine (5 mol%), and 1 mol% α-tocopherol (5 mM final lipid concentration). The ZnPC liposomes encapsulated calcein at a self-quenching concentration (53 mM, λex = 488 ± 5 nm, λem = 522 ± 5 nm) in the aqueous compartment. Disruption of the liposomal membrane results in leakage of calcein from the liposomes, abrogation of fluorescence quenching, and increase in calcein fluorescence. At t = 1 min, liposomes (lipos, blue arrow) were added to the cuvette in the fluorescence spectrometer, at t = 3 min the suspension was irradiated with a 670-nm laser (hv, blue arrow), and at t = 6 min Triton X-100, a detergent that solubilizes the liposome membrane, was added (TX100, blue arrow) to determine complete calcein release from the liposomes. Irradiation of ZnPC-encapsulating liposomes (red trace) resulted in rapid leakage of calcein from the liposomes, probably due to oxidative modification of phospholipids, whereas irradiation of ZnPC-lacking liposomes had no effect on membrane permeabilization. In (f) it is shown that the ROS produced by ZnPC liposomes have the ability to oxidize amino acid residues in bovine serum albumin (BSA). A similar experiment was performed as in (d), only the ZnPC-liposomes were suspended in buffer containing BSA. The fluorescence of tryptophan (λex = 280 ± 5 nm, λem = 360 ± 5 nm), an autofluorescent amino acid in BSA, was measured as a function of time. Oxidation of tryptophan leads to abrogation of fluorescence. At t = 2 min, the liposome-containing cuvette was irradiated with 670-nm light (hv, blue arrow). Oxidation of tryptophan occurred in samples containing ZnPC-liposomes (red trace) but not in samples containing ZnPC-lacking liposomes (black trace), as evidenced by the rapid reduction in fluorescence intensity. Data were normalized to tryptophan fluorescence at t = 1.99 min. The data in panels (e, f) comprise mean ± SD traces from n = 3 experiments (ZnPC-liposomes) and single traces for control liposomes. All data is unpublished
Figure 13
Figure 13
(a) Model liposomal DDS for antifibrinolytic site-specific pharmaco-laser therapy, consisting of 1,2-dipalmitoyl-sn-glycero-3-phosphocholine (DPPC, 96 mol%) and a molar fraction of polyethylene glycol-conjugated 1,2-distearoyl-sn-glycero-3-phosphoethanolamine (DSPE-PEG, 4 mol%). The phase transition temperature (T m) of this formulation is 42.3 °C, i.e., ~5 °C above body temperature. The PEG can be used to conjugate antibodies for immunotargeting to the laser-induced thrombus via e.g., P-selectin or fibrin. The liposomes encapsulate tranexamic acid (TA, green circles) in the aqueous compartment. The chemical structure of TA is provided in (b). (c) Mechanism of fibrinolysis and inhibitory pathways in the context of laser-induced thrombosis. Plasminogen is converted to plasmin by tissue-type plasminogen activator (tPA), which cleaves cross-polymerized fibrin strands in the thrombus, resulting in the generation of fibrin degradation products and embolization. Plasminogen activator inhibitor-1 (PAI-1) inhibits the conversion of plasminogen to plasmin, alpha-2 antiplasmin (α-2-AP) and thrombin-activatable fibrinolysis inhibitor (TAFI) antagonize the enzymatic activity of plasmin, and TA inhibits plasmin(ogen) at the lysine binding sites. The liposomes described in (a) were prepared with 316 mM TA and assayed for heat-induced drug release. (d) Heat-induced release kinetics of TA from thermosensitive liposomes measured near T m and 4 °C below T m (control) in buffer (10 mM HEPES, 0.88% NaCl, pH = 7.4, 0.292 osmol/kg). Near-complete TA release was achieved within 2.5 min of heating at 43.3 °C, whereas heating at 39.3 °C resulted in ~13% TA release after 5 min (unpublished results). In (e), heat-induced TA release from thermosensitive liposomes was measured in whole blood, exhibiting comparable TA release kinetics as in buffer

Similar articles

Cited by

References

    1. Adatto MA, Luc-Levy J, Mordon S. Efficacy of a novel intense pulsed light system for the treatment of port wine stains. J. Cosmet. Laser Ther. 2010;12:54–60. doi: 10.3109/14764171003706158. - DOI - PubMed
    1. Aguilar G, Franco W, Liu J, Svaasand LO, Nelson JS. Effects of hypobaric pressure on human skin: implications for cryogen spray cooling (part II) Laser Surg. Med. 2005;36:130–135. doi: 10.1002/lsm.20149. - DOI - PubMed
    1. Aguilar G, Svaasand LO, Nelson JS. Effects of hypobaric pressure on human skin: feasibility study for port wine stain laser therapy (part 1) Laser Surg. Med. 2005;36:124–129. doi: 10.1002/lsm.20140. - DOI - PubMed
    1. Allen TM, Hansen C, Martin F, Redemann C, Yauyoung A. Liposomes containing synthetic lipid derivatives of poly(ethylene glycol) show prolonged circulation half-lives in vivo. Biochim. Biophys. Acta. 1991;1066:29–36. doi: 10.1016/0005-2736(91)90246-5. - DOI - PubMed
    1. Alster TS, Tanzi EL. Combined 595-nm and 1, 064-nm laser irradiation of recalcitrant and hypertrophic port-wine stains in children and adults. Dermatol. Surg. 2009;35:914–919. doi: 10.1111/j.1524-4725.2009.01155.x. - DOI - PubMed

Publication types