

In vivo validation of numerical prediction for turbulence intensity in an aortic coarctation
- PMID: 22016327
- PMCID: PMC3880395
- DOI: 10.1007/s10439-011-0447-6
In vivo validation of numerical prediction for turbulence intensity in an aortic coarctation
Abstract
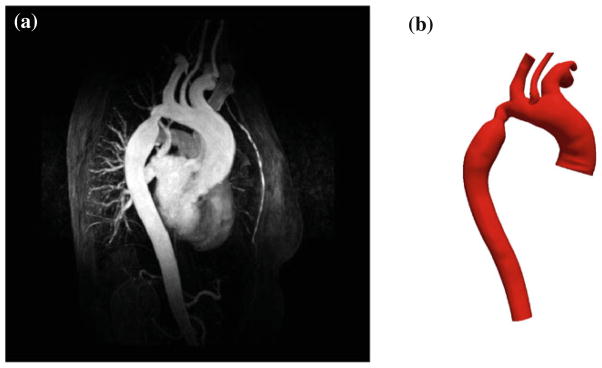
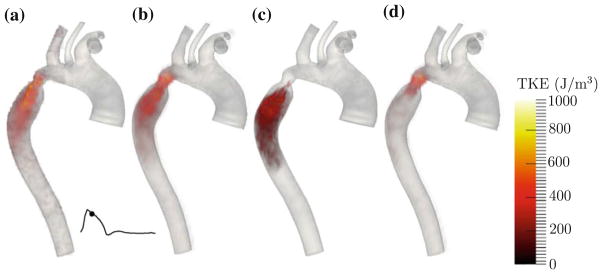
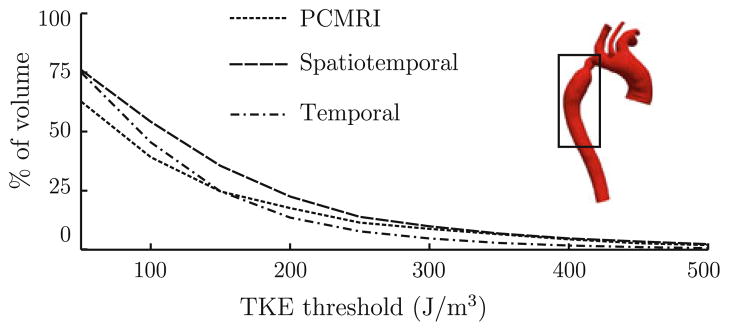
This paper compares numerical predictions of turbulence intensity with in vivo measurement. Magnetic resonance imaging (MRI) was carried out on a 60-year-old female with a restenosed aortic coarctation. Time-resolved three-directional phase-contrast (PC) MRI data was acquired to enable turbulence intensity estimation. A contrast-enhanced MR angiography (MRA) and a time-resolved 2D PCMRI measurement were also performed to acquire data needed to perform subsequent image-based computational fluid dynamics (CFD) modeling. A 3D model of the aortic coarctation and surrounding vasculature was constructed from the MRA data, and physiologic boundary conditions were modeled to match 2D PCMRI and pressure pulse measurements. Blood flow velocity data was subsequently obtained by numerical simulation. Turbulent kinetic energy (TKE) was computed from the resulting CFD data. Results indicate relative agreement (error ≈10%) between the in vivo measurements and the CFD predictions of TKE. The discrepancies in modeled vs. measured TKE values were within expectations due to modeling and measurement errors.
Figures

References
-
- Boussel L, Rayz V, Martin A, Acevedo-Bolton G, Lawton MT, Higashida R, Smith WS, Young WL, Saloner D. Phase-contrast magnetic resonance imaging measurements in intracranial aneurysms in vivo of flow patterns, velocity fields, and wall shear stress: comparison with computational fluid dynamics. Magn Reson Med. 2009;61(2):409–417. - PMC - PubMed
-
- Deissler RG. Turbulent Fluid Motion. Philadelphia: Taylor and Francis; 1998.
-
- Dyverfeldt P, Gardhagen R, Sigfridsson A, Karlsson M, Ebbers T. On MRI turbulence quantification. Magn Reson Med. 2009;27(7):913–922. - PubMed
-
- Dyverfeldt P, Kvitting JPE, Sigfridsson A, Engvall J, Bolger AF, Ebbers T. Assessment of fluctuating velocities in disturbed cardiovascular blood flow: in vivo feasibility of generalized phase-contrast MRI. J Magn Reson Imaging. 2008;28(3):655–663. - PubMed
-
- Dyverfeldt P, Sigfridsson A, Kvitting JPE, Ebbers T. Quantification of intravoxel velocity standard deviation and turbulence intensity by generalizing phase-contrast MRI. Magn Reson Med. 2006;56(4):850–858. - PubMed
Publication types
MeSH terms
Grants and funding
LinkOut - more resources
Full Text Sources
Miscellaneous
