. 2011 Dec 16;286(50):43172-81.
doi: 10.1074/jbc.M111.289777. Epub 2011 Oct 20.

Picomolar nitric oxide signals from central neurons recorded using ultrasensitive detector cells

Affiliations

Picomolar nitric oxide signals from central neurons recorded using ultrasensitive detector cells

Katherine C Wood et al. J Biol Chem. .

Abstract

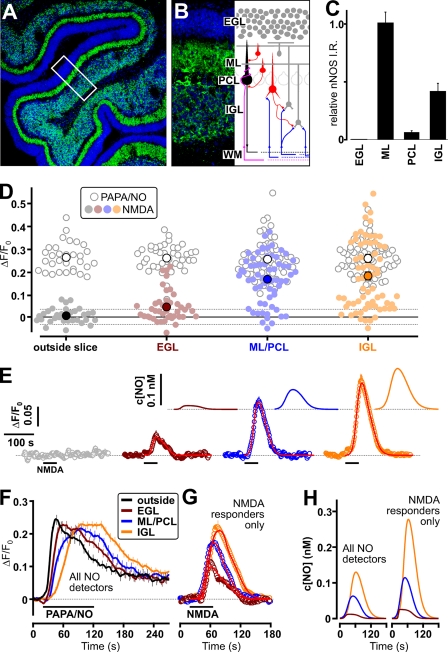
Nitric oxide (NO) is a widespread signaling molecule with potentially multifarious actions of relevance to health and disease. A fundamental determinant of how it acts is its concentration, but there remains a lack of coherent information on the patterns of NO release from its sources, such as neurons or endothelial cells, in either normal or pathological conditions. We have used detector cells having the highest recorded NO sensitivity to monitor NO release from brain tissue quantitatively and in real time. Stimulation of NMDA receptors, which are coupled to activation of neuronal NO synthase, routinely generated NO signals from neurons in cerebellar slices. The average computed peak NO concentrations varied across the anatomical layers of the cerebellum, from 12 to 130 pm. The mean value found in the hippocampus was 200 pm. Much variation in the amplitudes recorded by individual detector cells was observed, this being attributable to their location at variable distances from the NO sources. From fits to the data, the NO concentrations at the source surfaces were 120 pm to 1.4 nm, and the underlying rates of NO generation were 36-350 nm/s, depending on area. Our measurements are 4-5 orders of magnitude lower than reported by some electrode recordings in cerebellum or hippocampus. In return, they establish coherence between the NO concentrations able to elicit physiological responses in target cells through guanylyl cyclase-linked NO receptors, the concentrations that neuronal NO synthase is predicted to generate locally, and the concentrations that neurons actually produce.


Figures

FIGURE 1.
FIGURE 1.
Imaging NO release from cerebellar slices on exposure to NMDA. A, schematic showing NO detector cells (green) on a glass coverslip. A 200-μm-thick cerebellar slice was wedged on top and imaging was from below. B, brightfield image of a cerebellar slice (IGL, internal granule cell layer; PCL, Purkinje cell layer; ML, molecular layer; EGL, external granule cell layer). C, fluorescent image of underlying detector cells. D–F, images of ΔF/F0 before (D) and at the peak of the response (E) to 30 μm NMDA applied for 45 s and of 5 μm PAPA/NO applied for 90 s (F). Responses in two sample cells outlined in red in B and C and green in D–F are plotted in G and H, with the NO profiles computed from fits to the data (red lines) given in the insets. I–K, effect of increasing the NMDA concentration (3–100 μm) on ΔF/F0 (I) and c[NO] (J). NMDA was superfused for 45 s in ascending concentrations at 15 min intervals, 30 μm being repeated at the end. Lines (I) fit the c[NO] profiles to the data. K, concentration response curves for c[NO]. A logistic fit to values for all the detector cells in this experiment (All; n = 21) gave the stated EC50 and Hill slope (nH). When subdivided into High (> 0.5 nm) and Low (<0.5 nm) responders based on the peak c[NO] at 100 μm NMDA, EC50 and Hill slope values were 30 ± 5 μm and 2.7 ± 1.8 (High; n = 14), and 40 ± 22 μm and 2.1 ± 1.6 (Low; n = 7), respectively, neither of which differs significantly (p = 0.7 and 0.6).
FIGURE 2.
FIGURE 2.
Pharmacology of NMDA-induced NO release from cerebellar slices. Data show ΔF/F0 in detector cells (n = 12–22) on applying 30 μm NMDA (black bars) in the absence and presence of 30 μm l-nitroarginine (L-NNA; A), 10 μm ODQ (B), 50 μm d-2-amino-5-phosphonopentanoic acid (d-AP5; C), 1 μm tetrodotoxin (D), and 30 μm bicuculline (E); D and E are from the same experiment. PAPA/NO (5 μm) and 8-bromo-cGMP (8-Br-cGMP, 1 mm) were added as controls at the end in A and B, respectively. Insets, c[NO] profiles, numbered in chronological order; their fits to the experimental data are shown by red lines in the main panels.
FIGURE 3.
FIGURE 3.
Regional distribution of NO release in cerebellar slices and its relationship to nNOS immunostaining. A, low power image of cerebellar section immunostained for nNOS (green). Nuclei are stained blue. A region is shown in B at a higher power (the orientation is indicated by the rectangle in A), together with a schematic showing the main constituent neurons and circuitry (WM, white matter; IGL, internal granule cell layer; PCL, Purkinje cell layer; ML, molecular layer; EGL, external granule cell layer). C, quantification of the nNOS immunoreactivity in different cerebellar layers. Three different regions, having the dimensions of the rectangle in A, were analyzed using ImageJ (http://rsbweb.nih.gov/ij/). D, distribution of peaks of detector cell responses to 30 μm NMDA (filled symbols) and 5 μm PAPA/NO (open symbols) outside the slices and under the different cerebellar layers (ML/PCL = molecular plus Purkinje cell layers) in seven experiments; larger symbols are mean values. Broken horizontal lines are ± S.D. of the baseline noise. Time courses of the mean responses are shown in E, with the c[NO] profiles shown in the insets. Red lines (main panel) are fits of the c[NO] profiles to the data. F, average of the responses of the same cells in D and E to PAPA/NO. G, mean responses of only those detector cells giving a measurable response to NMDA, the corresponding c[NO] profiles being shown in H (right) in comparison with profiles from all detector cells (left). For clarity, errors for every fifth point are shown in F and G. Lines in G are fits of the c[NO] profiles to the data. The box in A (expanded in B) is 105 × 276 μm.
FIGURE 4.
FIGURE 4.
Effect of CPTIO and O2 on NO detector cell responses to stimulation of cerebellar slices with NMDA. A, increased detector response to NMDA (30 μm, 45 s) in the presence of the NO scavenger CPTIO in one experiment. The mean change in three experiments was +12 ± 9%. As shown by the simulation (B and C) this increase can be largely explained by a diminution in the proportion of the persistently active PDE5 (pPDE5*) after the second NMDA application, with an unaltered NO profile. D and E, detector cell responses to NMDA showed no obvious change when the superfusion solution was switched from one equilibrated with air (21% O2) to one equilibrated with pure O2 (D) or vice versa (E). Pure O2 was used from the start of the experiment in E; D and E are separate experiments.
FIGURE 5.
FIGURE 5.
Heterogeneity of NO sources and signals in cerebellar slices. A, spread of peak c[NO] (red stars) registered in individual detector cells on stimulation by NMDA (30 μm, 45 s) according to their cerebellar location. Detector cells outlined in yellow are non-responders (but responders to PAPA/NO). B, skewed frequency distribution of individual peak c[NO] in responder cells in five experiments (95 cells; 10 pm bins). The data conformed to a lognormal distribution, as shown by the linear lognormal probability plots of the same data separated according to location (inset). For analysis of these data, see Table 1. C, thumbnails of nNOS immunostaining (red glow) in a cerebellar slice (after incubation) at the distances from the outermost plane indicated at the left of each frame. Nuclei are stained cyan. D, enlargement of a lobule (outlined in C). At the right and below are images in the z-plane at the positions of the yellow lines, showing nNOS staining from the slice surface inwards (P = Purkinje cell somata). The scale bar (lower right) applies to all planes. E, co-staining for nNOS (green) and the Purkinje cell marker, calbindin (red), in a cerebellar slice. IGL, internal granule cell layer; PCL, Purkinje cell layer; ML, molecular layer; EGL, external granule cell layer.
FIGURE 6.
FIGURE 6.
Detection of NO from NMDA-stimulated hippocampal slices. A, schematic of a hippocampal slice, indicating the region (boxed) shown in the brightfield (B) and fluorescent (C) experimental images. The angled structure demarcated by dots in B (fluorescing mildly in C) is a strand of the slice anchor. Pyr, pyramidal cell layer. Detector cells (C) are outlined in red. D, mean detector cell responses to NMDA (30 μm, 45 s) in one experiment in the absence and presence of l-nitroarginine (L-NNA, 30 μm), with a control application of PAPA/NO (5 μm, 90 s) at the end. Insets are the c[NO] profiles from the control NMDA applications; red lines (main panel) are their fits to the data. E, comparison of the mean c[NO] time courses in cerebellum versus hippocampus (normalized to the maxima); the times for 50% decay from the peak were 31 s (cerebellum; n = 95; five experiments) and 60 s (hippocampus; n = 14; two experiments).

Similar articles

Cited by

References

    1. Garthwaite J. (2008) Eur. J. Neurosci. 27, 2783–2802 - PMC - PubMed
    1. Knowles R. G., Moncada S. (1992) Trends Biochem. Sci. 17, 399–402 - PubMed
    1. Rand M. J., Li C. G. (1995) Annu. Rev. Physiol. 57, 659–682 - PubMed
    1. Ignarro L. J. (1991) Biochem. Pharmacol. 41, 485–490 - PubMed
    1. Murad F. (1994) Recent Prog. Horm. Res. 49, 239–248 - PubMed

Publication types