. 2011 Dec 9;286(49):42349-42359.
doi: 10.1074/jbc.M111.278598. Epub 2011 Oct 20.

Hyaluronan synthase 2 (HAS2) promotes breast cancer cell invasion by suppression of tissue metalloproteinase inhibitor 1 (TIMP-1)

Affiliations

Hyaluronan synthase 2 (HAS2) promotes breast cancer cell invasion by suppression of tissue metalloproteinase inhibitor 1 (TIMP-1)

Berit Bernert et al. J Biol Chem. .

Abstract

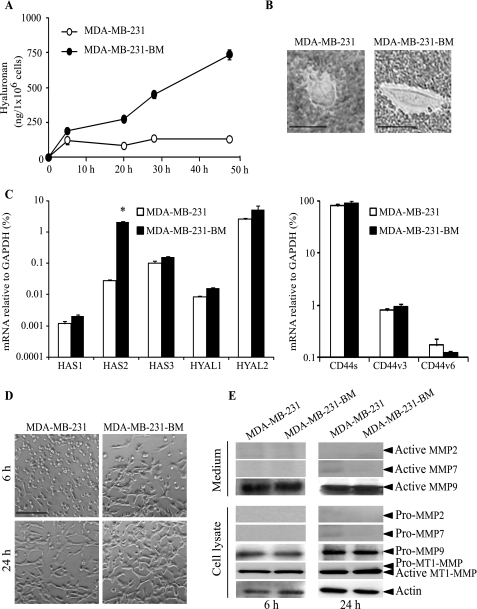
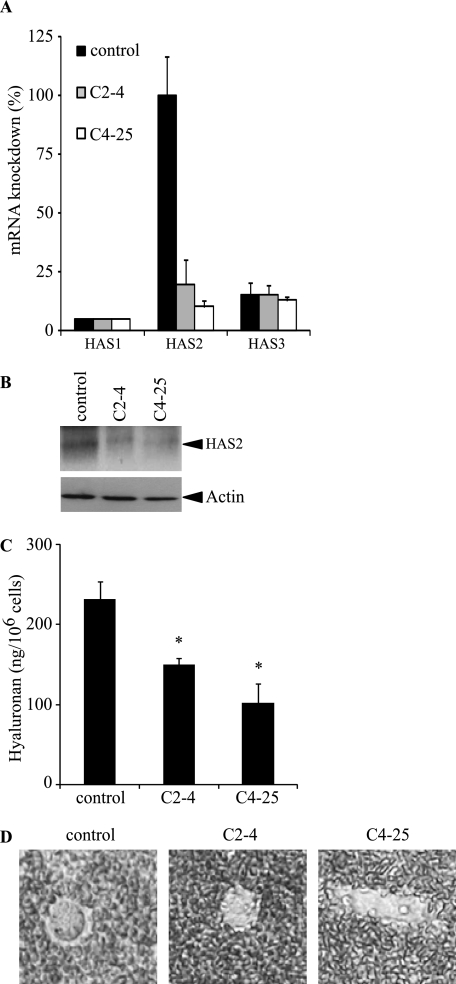
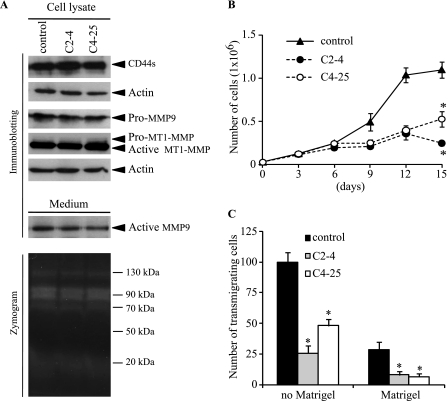
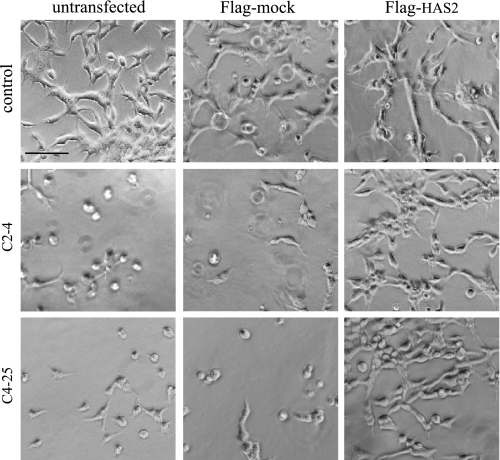
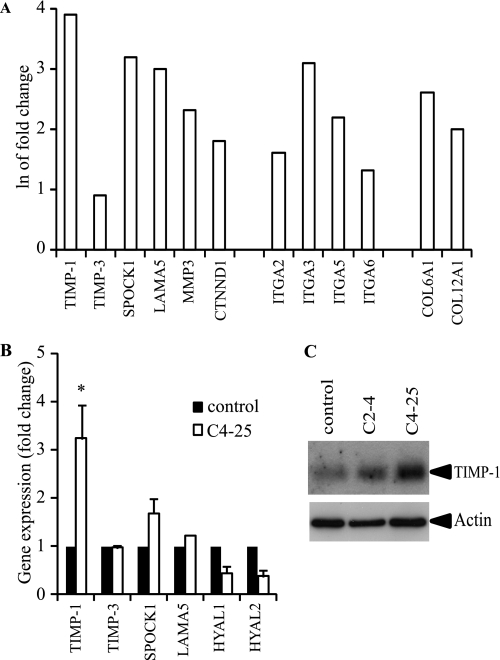
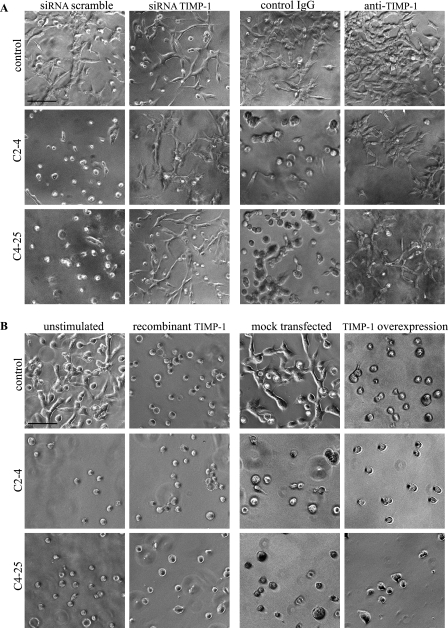
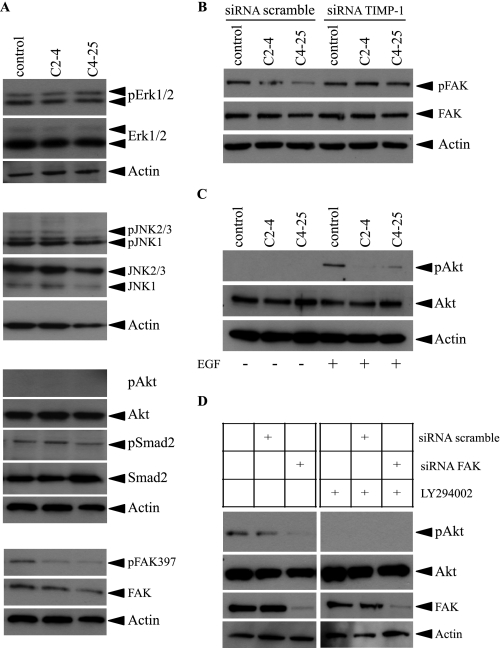
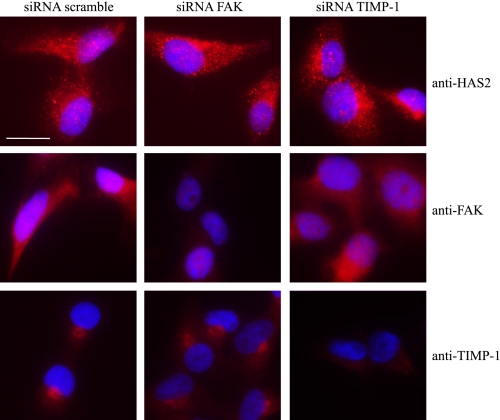
Invasion and metastasis are the primary causes of breast cancer mortality, and increased knowledge about the molecular mechanisms involved in these processes is highly desirable. High levels of hyaluronan in breast tumors have been correlated with poor patient survival. The involvement of hyaluronan in the early invasive phase of a clone of breast cancer cell line MDA-MB-231 that forms bone metastases was studied using an in vivo-like basement membrane model. The metastatic to bone tumor cells exhibited a 7-fold higher hyaluronan-synthesizing capacity compared with MDA-MB-231 cells predominately due to an increased expression of hyaluronan synthase 2 (HAS2). We found that knockdown of HAS2 completely suppressed the invasive capability of these cells by the induction of tissue metalloproteinase inhibitor 1 (TIMP-1) and dephosphorylation of focal adhesion kinase. HAS2 knockdown-mediated inhibition of basement membrane remodeling was rescued by HAS2 overexpression, transfection with TIMP-1 siRNA, or addition of TIMP-1-blocking antibodies. Moreover, knockdown of HAS2 suppressed the EGF-mediated induction of the focal adhesion kinase/PI3K/Akt signaling pathway. Thus, this study provides new insights into a possible mechanism whereby HAS2 enhances breast cancer invasion.


Figures

FIGURE 1.
FIGURE 1.
Characterization of MDA-MB-231 and MDA-MB-231-BM cells with regard to hyaluronan production; HAS, HYAL, and CD44 mRNA expression; and invasive behavior. A, hyaluronan production. Cells (2 × 10⁵) were seeded in a 6-cm dish and grown for the indicated time periods. Conditioned media were collected, and the hyaluronan amount was determined. The graph shows the average ± S.D. of triplicates. B, assembly of pericellular matrices. MDA-MB-231 and MDA-MB-231-BM cells (2 × 10⁴ cells/well) were seeded in 6-well plates, and their hyaluronan coat was determined by a particle exclusion assay after 24 h. Photographs were taken with a Zeiss Axiovert phase-contrast microscope. Scale bars = 25 μm. C, HAS, HYAL, and CD44 mRNA expression. Cells (2 × 10⁵ cells/well) were grown in 12-well plates for 24 h. The expression levels relative to GAPDH of HAS1, HAS2, HAS3, HYAL1, HYAL2, CD44s, CD44v3, and CD44v6 mRNAs were determined by real-time PCR as described under “Materials and Methods.” Results are means ± S.D. of triplicate determination. *, p < 0.05 (Student's t test, significant difference compared with MDA-MB-231 cells). D, in vivo-like invasion assay. Cells (1.5 × 10⁵ cells/well, 48-well plates) were embedded in 100 μl of growth factor-reduced Matrigel/dish and incubated for 6 or 24 h. Representative pictures were taken with a Zeiss Axiovert phase-contrast microscope. Scale bar = 100 μm. E, expression of MMP2, MMP7, MMP9, and MT1-MMP proteins. Cell lysates and conditioned media were subjected to SDS-PAGE using 10% polyacrylamide gels, followed by immunoblotting with antisera against MMP2, MMP7, MMP9, MT1-MMP, and actin as described under “Materials and Methods.” The data presented are from a representative experiment of two performed with similar results.
FIGURE 2.
FIGURE 2.
Characterization of MDA-MB-231-BM cells transfected with HAS2 shRNA. A, effect of HAS1, HAS2, and HAS3 mRNAs on expression. Two clones (C2-4 and C4-25) in which HAS2 was silenced by shRNA-expressing vectors, as well as control transfected cells, were subjected to analysis of HAS1, HAS2, and HAS3 mRNA expression levels by real-time PCR. Results are means ± S.D. of triplicate determination. B, effect of HAS2 protein on expression. Cell lysates were subjected to SDS-PAGE, followed by immunoblotting with antisera against HAS2 (anti-CGR) and actin. C, effect on hyaluronan production. The hyaluronan content of 24-h conditioned media was determined in an ELISA-like approach as described under “Materials and Methods.” Results are means ± S.D. of triplicate determination. *, p < 0.05 (Student's t test, significant difference compared with control cells). D, effect on pericellular matrices. Hyaluronan-containing pericellular matrices surrounding cells expressing HAS2 or not were determined by a particle exclusion assay after 24 h. Photographs were taken with a Zeiss Axiovert phase-contrast microscope. The data presented are from a representative experiment of two performed with similar results.
FIGURE 3.
FIGURE 3.
Further characterization of MDA-MB-231-BM cells transfected with HAS2 shRNA. A, effect of CD44, MMP9, and MT1-MMP proteins and MMP activity on expression. Cell lysates or conditioned media from cells grown on Matrigel were subjected to SDS-PAGE, followed by immunoblotting for CD44, MMP9, and MT1-MMP. MMP activity was determined in by gelatin zymography. Shown is a representative experiment of two separate experiments performed with similar results. B, effect on cell proliferation. The cell numbers of control HAS2 shRNA-expressing, HAS2 shRNA-expressing C2-4, and HAS2 shRNA-expressing C4-25 MDA-MB-231-BM cells were measured up to 15 days after seeding. C, effect on cell migration and invasion. Unlayered and Matrigel-layered Transwell 24-well units (8-μm pore size) were used for the migration and invasion assays, respectively. In both B and C, data represent the mean of triplicates from one of two separate experiments. *, p < 0.05 (Student's t test, significant difference compared with control HAS2 shRNA-expressing MDA-MB-231-BM cells).
FIGURE 4.
FIGURE 4.
Deprivation of HAS2 inhibits the invasive behavior of MDA-MB-231-BM cells and rescue by HAS2 expression. Control HAS2 shRNA-expressing, HAS2 shRNA-expressing C2-4, and HAS2 shRNA-expressing C4-25 breast cancer cells were subjected to an in vivo-like three-dimensional invasion assay for 24 h as described under “Materials and Methods” prior to or after transfection with FLAG-mock or FLAG-HAS2 constructs. Photographs were taken with a Zeiss Axiovert phase-contrast microscope. Scale bar = 100 μm.
FIGURE 5.
FIGURE 5.
Microarray and real-time RT-PCR gene analyses reveal that HAS2 suppression causes TIMP-1 induction. Cells were grown embedded in Matrigel for 24 h, after which RNAs were prepared and subjected to microarray (A) and RT-PCR (B) analyses as described under “Materials and Methods.” Displayed are the -fold changes in gene expression in HAS2 shRNA-expressing C4-25 cells (open bars) compared with control HAS2 shRNA-expressing MDA-MB-231-BM cells (black bars). Results show a representative experiment from two separate experiments performed in triplicate. *, p < 0.05 (Student's t test, statistically significant difference between the two cell types). C, immunoblotting. Conditioned media were subjected to immunoblotting for TIMP-1, and correlative amounts of cell lysates were used as loading controls.
FIGURE 6.
FIGURE 6.
A, abrogation of HAS2-induced TIMP-1 expression potentiates the invasive potential. MDA-MB-231-BM cells deprived or not of HAS2 were cotransfected with scrambled siRNA or siRNA for TIMP-1 or treated with control antibodies or blocking antibodies against TIMP-1 during their culturing in in vivo-like Matrigel matrix. Photographs were taken after 24 h of culture with a Zeiss Axiovert phase-contrast microscope. Scale bar = 100 μm. A representative experiment of three separate experiments performed with similar results is shown. B, overexpression of TIMP-1 by transfection or treatment with recombinant TIMP-1 inhibits invasiveness. Control or HAS2 shRNA knockdown cells were either treated with 5 ng/ml human recombinant TIMP-1 or transfected with pCMV6-XL5-TIMP-1 or mock plasmid, respectively, prior to seeding on Matrigel. Phase-contrast photographs were taken after 24 h. Scale bar = 100 μm.
FIGURE 7.
FIGURE 7.
Effect of HAS2 deprivation on signaling pathways. A, activation of signaling molecules. Lysates from control HAS2 shRNA-expressing or HAS2-deprived C2-4 and C4-25 MDA-MB-231-BM cells cultured under in vivo-like conditions were subjected to SDS-PAGE, followed by immunoblotting with antibodies against phospho-ERK, ERK, phospho-JNK, JNK, phospho-Akt, Akt, phospho-Smad2, Smad2, phospho-FAK, and FAK signaling molecules. Actin expression was used as a loading control. B, effect of knockdown of TIMP-1 on FAK activation. Immunoblotting was performed on lysate from control HAS2 shRNA-expressing cells or from HAS2-deprived C2-4 and C4-25 cells that were transiently transfected with siRNA for TIMP-1. Immunoblotting was performed with antibodies against phospho-FAK, FAK, and actin. The data presented are from a representative experiment of three performed with similar results. C, EGF-mediated activation of Akt. Cells (control or HAS2-deprived clones) were starved overnight, stimulated with 10 ng/ml EGF or Me2SO, lysed, and subjected to SDS-PAGE, followed by immunoblotting with antibodies against phospho-Akt, Akt, or actin (as a loading control). D, effect of FAK suppression on EGF-mediated activation of Akt. HAS2-expressing cells (control HAS2 shRNA) were transfected with scrambled siRNA or FAK siRNA and stimulated with EGF (10 ng/ml) in the absence or presence of the PI3K inhibitor LY294002. Cell lysates were then subjected to immunoblotting with antibodies against phospho-Akt, Akt, FAK, and actin.
FIGURE 8.
FIGURE 8.
Knockdown of TIMP-1 or FAK does not affect HAS2 expression. Control HAS2 shRNA-expressing cells were transfected with scrambled siRNA or siRNA against TIMP-1 or FAK, starved, and subsequently immunostained with antibodies against HAS2 (anti-CGR). Scale bar = 11 μm.

Similar articles

Cited by

References

    1. Kalluri R. (2003) Nat. Rev. Cancer 3, 422–433 - PubMed
    1. Hotary K., Li X. Y., Allen E., Stevens S. L., Weiss S. J. (2006) Genes Dev. 20, 2673–2686 - PMC - PubMed
    1. Srivastava A., Pastor-Pareja J. C., Igaki T., Pagliarini R., Xu T. (2007) Proc. Natl. Acad. Sci. U.S.A. 104, 2721–2726 - PMC - PubMed
    1. Bigelow R. L., Williams B. J., Carroll J. L., Daves L. K., Cardelli J. A. (2009) Breast Cancer Res. Treat. 117, 31–44 - PubMed
    1. Schrohl A. S., Holten-Andersen M. N., Peters H. A., Look M. P., Meijer-van Gelder M. E., Klijn J. G., Brünner N., Foekens J. A. (2004) Clin. Cancer Res. 10, 2289–2298 - PubMed

Publication types