Review
. 2012 May;33(5):803-17.
doi: 10.3174/ajnr.A2640. Epub 2011 Oct 20.

MR imaging of neoplastic central nervous system lesions: review and recommendations for current practice

Affiliations
Review

MR imaging of neoplastic central nervous system lesions: review and recommendations for current practice

M Essig et al. AJNR Am J Neuroradiol. 2012 May.

Abstract

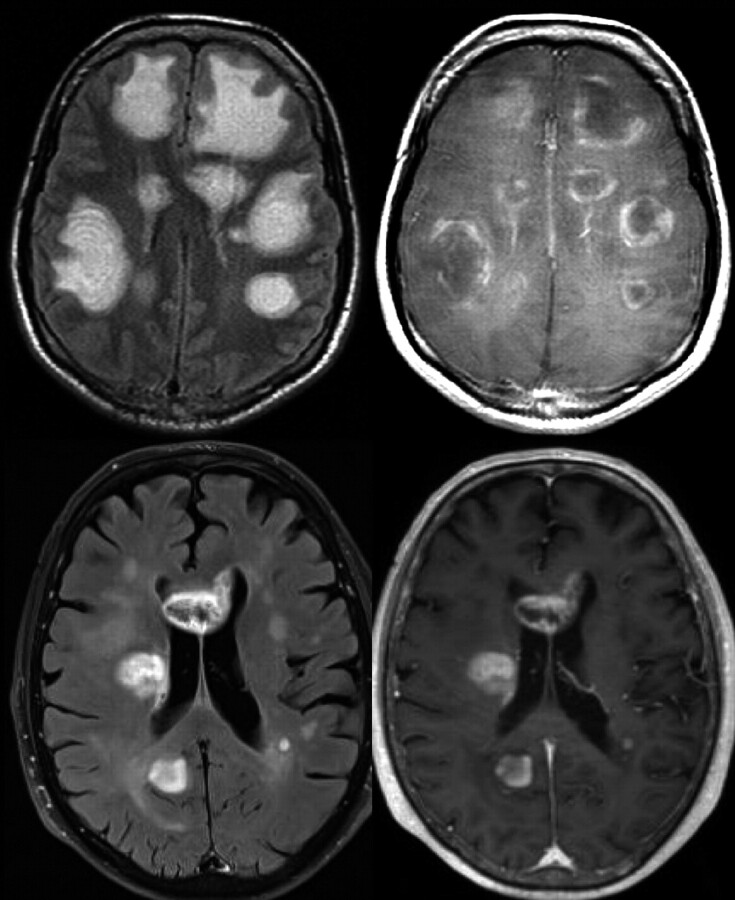
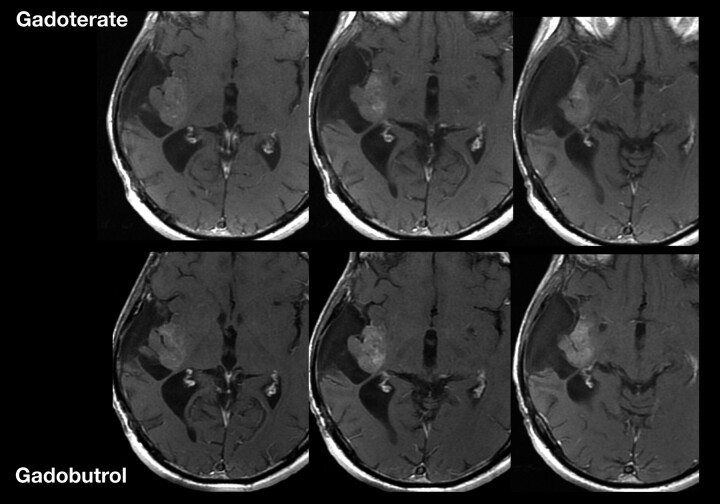
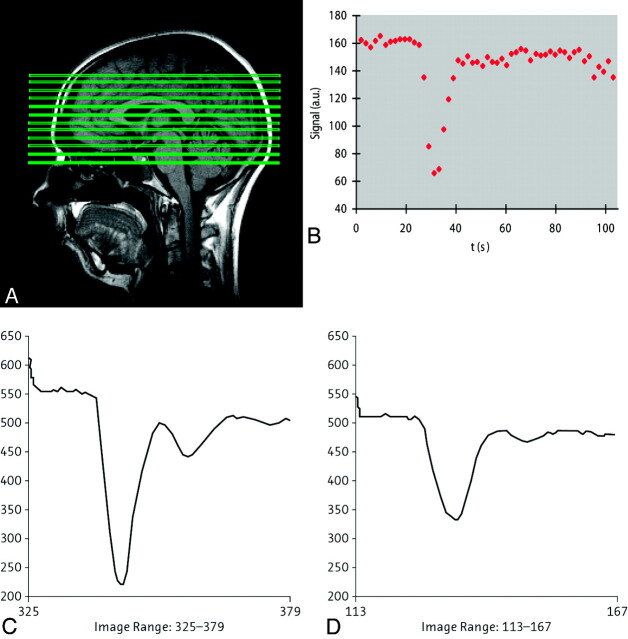
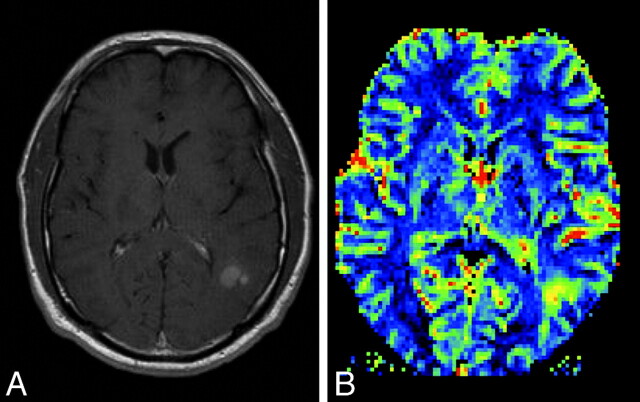
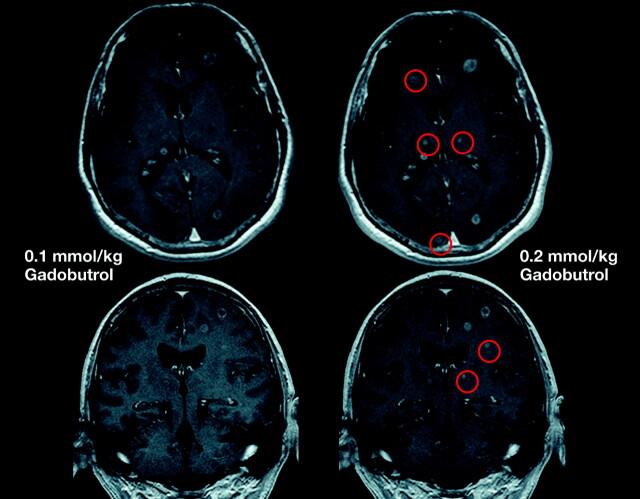
MR imaging is the preferred technique for the diagnosis, treatment planning, and monitoring of patients with neoplastic CNS lesions. Conventional MR imaging, with gadolinium-based contrast enhancement, is increasingly combined with advanced, functional MR imaging techniques to offer morphologic, metabolic, and physiologic information. This article provides updated recommendations to neuroradiologists, neuro-oncologists, neurosurgeons, and radiation oncologists on the practical applications of MR imaging of neoplastic CNS lesions in adults, with particular focus on gliomas, based on a review of the clinical trial evidence and personal experiences shared at a recent international meeting of experts in neuroradiology, neuro-oncology, neurosurgery, and radio-oncology.


Figures

Fig 1.
Fig 1.
Intrinsic lesion architecture. A Baló-like pattern (alternating layers of preserved and destroyed myelin) can be identified in a patient with multiple pseudotumoral inflammatory-demyelinating lesions, which shows peripheral contrast uptake (acute disseminated encephalomyelitis) (upper row). This finding is not typically present in high-grade gliomas, as shown in a patient with multiple hemispheric masses that enhanced after contrast administration, which proved to be a multifocal glioblastoma (lower row).
Fig 2.
Fig 2.
Patterns of contrast media uptake. A large tumefactive inflammatory lesion involving the corpus callosum shows an open ring enhancement with the open border facing the cortical gray matter (upper row). This feature is not typically seen in high-grade gliomas, where peripheral enhancement is identified even in the margins of the lesion in contact with the gray matter (lower row).
Fig 3.
Fig 3.
MR imaging (FLAIR, contrast-enhanced T1-weighted, and cerebral blood flow maps acquired with arterial spin-labeling) obtained in patients with a high-grade necrotic glioma (upper row) and an acute inflammatory-demyelinating lesion (lower row). Observe how, despite similar lesion patterns on both T2- and contrast-enhanced T1-weighted sequences, only the high-grade glioma shows a clear increase in cerebral blood flow.
Fig 4.
Fig 4.
Kaplan-Meier survival curves for progression-free survival within a low-grade glioma group with low and high rCBV (<1.75 and >1.75, respectively; solid lines) demonstrating a significant difference in time to progression in low-grade gliomas stratified by rCBV alone (P < .0001). Similarly, when comparing high-grade gliomas (broken lines), one sees a significant difference in progression with high-versus-low rCBV (<1.75 versus >1.75) (P < .0001). Among subjects with low rCBV (<1.75), there is a significant difference between low- and high-grade gliomas with respect to progression-free survival (P = .047). However, among subjects with high rCBV (> 1.75), progression-free survival is not significantly different for low-versus-high-grade gliomas (P = .266). Reprinted with permission from Radiology (2008;247:490–98). Copyright 2008, Radiological Society of North America.
Fig 5.
Fig 5.
Pseudoprogression in left frontal anaplastic astrocytoma. A, Axial T1-weighted image with contrast shows posttherapeutic brain with nodular contrast enhancement. B, Axial FLAIR image demonstrates increased edema surrounding the enhancing lesion. C, Permeability/Ktrans map with the region of interest. D, DCE MR imaging T1 signal intensity curve demonstrates reduced perfusion and permeability, suggesting pseudoprogression rather than recurrent tumor. Therapy was continued because the findings were thought to be due to pseudoprogression from chemoradiation therapy. E, Permeability/Ktrans color overlay, again confirming decreased vascularity and Ktrans. F, Histogram of each pixel within the region of interest in C, confirming that the permeability is in the lower range, demonstrating pseudoprogression rather than true disease progression. Courtesy of M. Law, Los Angeles, California.
Fig 6.
Fig 6.
Time course of pseudoprogression and change in the reference or baseline MR imaging. Criteria for determining progression are dependent on the time from initial chemotherapy and radiation. If one takes the reference MR image immediately postoperative, the first 12-week MR image may represent pseudoprogression and pseudoresponse. If one takes the reference scan after that initial 12-week period, then it essentially excludes pseudoprogression. Note enhancement outside the radiation field, where any enhancement may indicate disease progression. To avoid interpretation of postoperative changes as residual enhancing disease, one should ideally obtain a reference MR image within 24–48 hours after surgery and no later than 72 hours after surgery.
Fig 7.
Fig 7.
Comparison of MR images at 1.5 and 3T in a patient with astrocytoma grade III after administration of gadobutrol, 0.1 mmol/kg.
Fig 8.
Fig 8.
Comparison of MR images at increasing time intervals after administration of gadobutrol, 0.1 mmol/kg.
Fig 9.
Fig 9.
Comparison of T1 shortening effect among gadolinium-based contrast media, based on Port et al 2005 and Rohrer et al 2005..
Fig 10.
Fig 10.
Recurrent right temporoinsular glioma in a 48-year-old patient. Consecutive axial views of T1-weighted images after a single dose (0.1 mmol/kg body weight) of gadoterate dimeglumine or gadobutrol. On gadobutrol-enhanced images, the tumor presents with significantly stronger contrast enhancement, which allows better delineation of suspected anaplastic tumor from nonenhancing tumor areas and adjacent structures.
Fig 11.
Fig 11.
A, Sagittal scout MR image with the position of the sections in which perfusion information is acquired. B, Signal intensity–time curve from DSC MR imaging after a bolus injection of a single dose of contrast agent, with substantial signal intensity drop due to the susceptibility effect of the contrast medium. C and D, Signal intensity–time curves from different contrast medium concentrations at a triple dose: 28 mL of the 1.0 mol/L gadobutrol formulation (C) and 56 mL of a 0.5 mol/L gadobutrol formulation (D) in the putamen of the same subject. The susceptibility effect is significantly stronger by using a higher concentration of contrast medium. C and D, reprinted with permission from Radiology (2003;226:880–88). Copyright 2003, Radiological Society of North America.
Fig 12.
Fig 12.
A, Postcontrast T1-weighted MR image in a patient with a new appearance of a contrast-enhancing lesion in a formerly radiotherapeutically treated fibrillary astrocytoma. From conventional imaging sequences, one cannot differentiate treatment-related blood-brain barrier breakdown and malignization of the tumor. B, rCBF perfusion parameter image shows a highly perfused lesion, which was suspicious and later histologically confirmed as a high-grade tumor nodule within the low-grade astrocytoma.
Fig 13.
Fig 13.
Comparison of MR images by using gadobutrol at 0.1 and 0.2 mmol/kg. Single-dose (left) and double-dose (right) contrast-enhanced MR images in a patient with cerebral metastases. With the use of double-dose gadobutrol, one can detect substantially more lesions (circles) (see also Kim et al 2010) and lesions already visualized with an improved contrast and a better delineation.

References

    1. Essig M, Weber MA, Tengg-Kobligk H, et al. . Contrast-enhanced magnetic resonance imaging of central nervous system tumors: agents, mechanisms, and applications. Top Magn Reson Imaging 2006;17:89–106 - PubMed
    1. Runge VM, Muroff LR, Wells JW. Principles of contrast enhancement in the evaluation of brain diseases: an overview. J Magn Reson Imaging 1997;7:5–13 - PubMed
    1. Schellinger PD, Meinck HM, Thron A. Diagnostic accuracy of MRI compared to CCT in patients with brain metastases. J Neurooncol 1999;44:275–81 - PubMed
    1. Yuh WT, Tali ET, Nguyen HD, et al. . The effect of contrast dose, imaging time, and lesion size in the MR detection of intracerebral metastasis. AJNR Am J Neuroradiol 1995;16:373–80 - PMC - PubMed
    1. Runge VM, Muroff LR, Jinkins JR. Central nervous system: review of clinical use of contrast media. Top Magn Reson Imaging 2001;12:231–63 - PubMed

Publication types