

Neurogenic changes in the upper airway of patients with obstructive sleep apnea
- PMID: 22016445
- PMCID: PMC3297112
- DOI: 10.1164/rccm.201106-1058OC
Neurogenic changes in the upper airway of patients with obstructive sleep apnea
Abstract
Rationale: Controversy persists regarding the presence and importance of hypoglossal nerve dysfunction in obstructive sleep apnea (OSA).
Objectives: We assessed quantitative parameters related to motor unit potential (MUP) morphology derived from electromyographic (EMG) signals in patients with OSA versus control subjects and hypothesized that signs of neurogenic remodeling would be present in the patients with OSA.
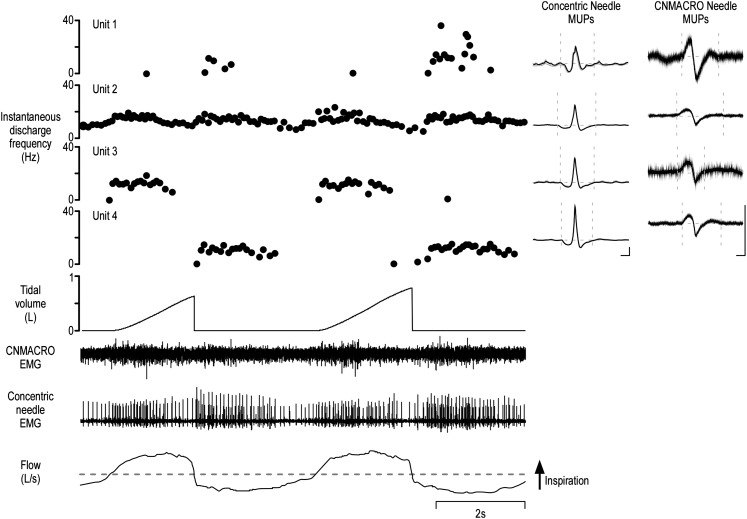
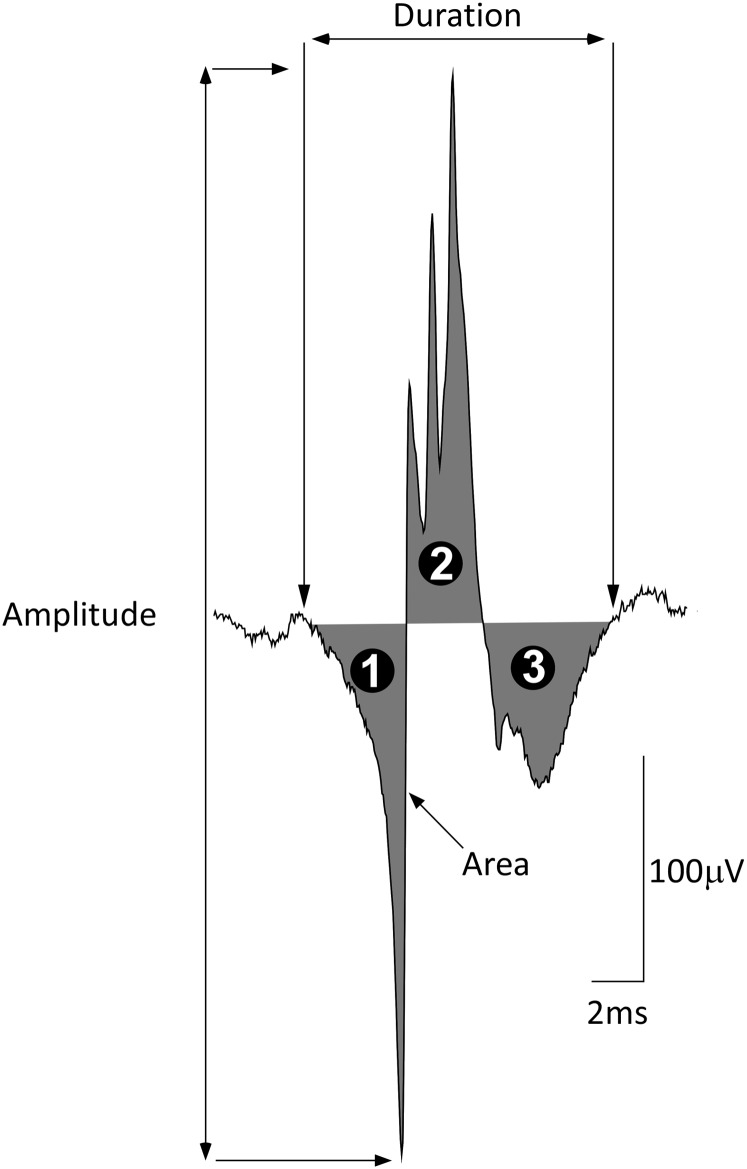
Methods: Participants underwent diagnostic sleep studies to obtain apnea-hypopnea indices. Muscle activity was detected with 50-mm concentric needle electrodes. The concentric needle was positioned at more than 10 independent sites per subject, after the local anatomy of the upper airway musculature was examined by ultrasonography. All activity was quantified with subjects awake, during supine eupneic breathing while wearing a nasal mask connected to a pneumotachograph. Genioglossus EMG signals were analyzed offline by automated software (DQEMG), which extracted motor unit potential trains (MUPTs) contributed by individual motor units from the composite EMG signals. Quantitative measurements of MUP templates, including duration, peak-to-peak amplitude, area, area-to-amplitude ratio, and size index, were compared between the untreated patients with OSA and healthy control subjects.
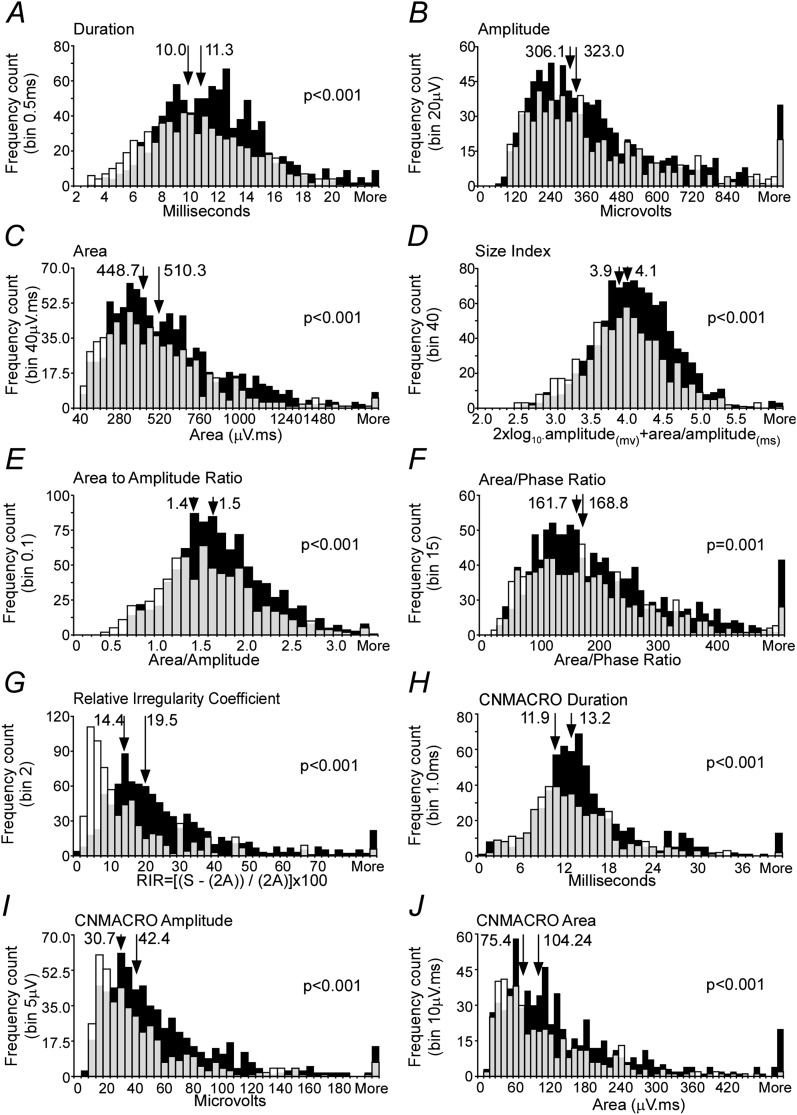
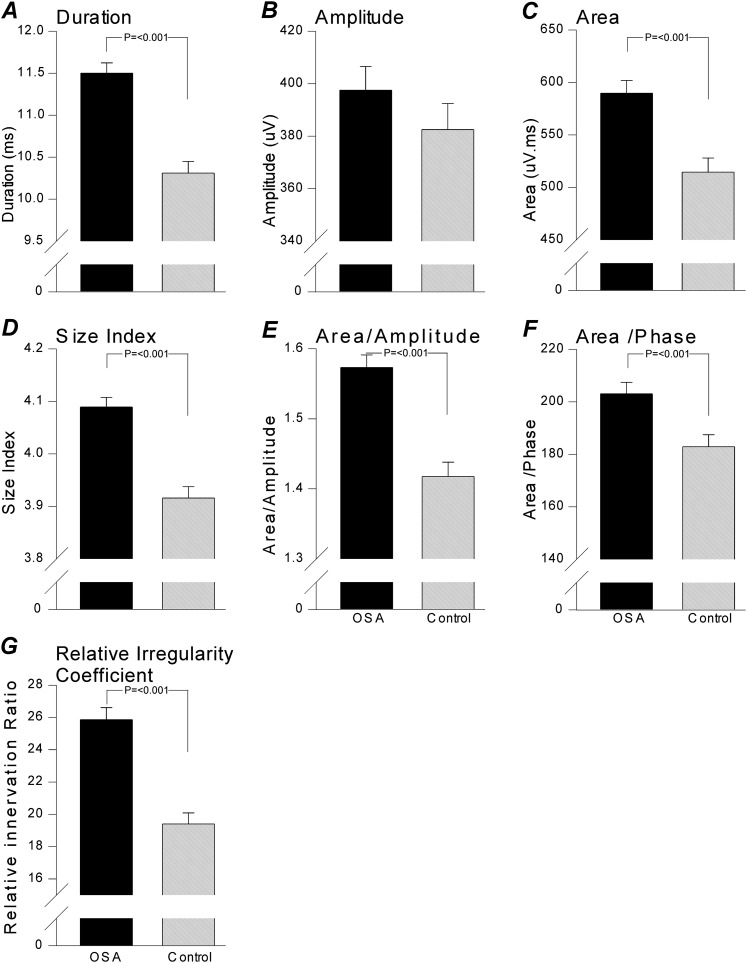
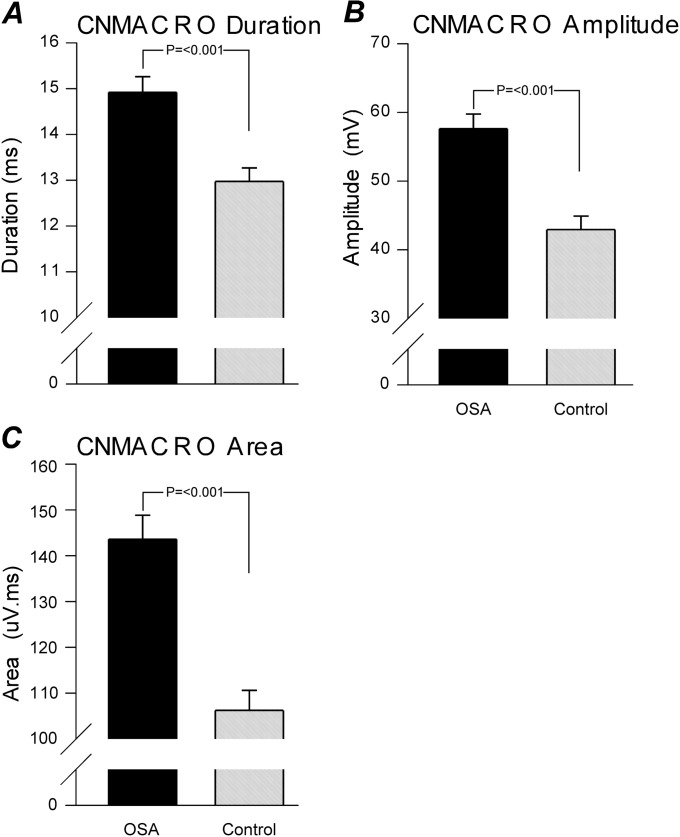
Measurements and main results: A total of 1,655 MUPTs from patients with OSA (n = 17; AHI, 55 ± 6/h) and control subjects (n = 14; AHI, 4 ± 1/h) were extracted from the genioglossus muscle EMG signals. MUP peak-to-peak amplitudes in the patients with OSA were not different compared with the control subjects (397.5 ± 9.0 vs. 382.5 ± 10.0 μV). However, the MUPs of the patients with OSA were longer in duration (11.5 ± 0.1 vs. 10.3 ± 0.1 ms; P < 0.001) and had a larger size index (4.09 ± 0.02 vs. 3.92 ± 0.02; P < 0.001) compared with control subjects.
Conclusions: These results confirm and quantify the extent and existence of structural neural remodeling in OSA.
Figures
Comment in
-
Pharyngeal neuropathy in obstructive sleep apnea: where are we going?Am J Respir Crit Care Med. 2012 Feb 1;185(3):241-3. doi: 10.1164/rccm.201111-1992ED. Am J Respir Crit Care Med. 2012. PMID: 22298363 No abstract available.
Similar articles
-
Inhomogeneous neuromuscular injury of the genioglossus muscle in subjects with obstructive sleep apnea.Sleep Breath. 2015 May;19(2):539-45. doi: 10.1007/s11325-014-1044-3. Epub 2014 Aug 10. Sleep Breath. 2015. PMID: 25107373
-
Effects of aging on genioglossus motor units in humans.PLoS One. 2014 Aug 11;9(8):e104572. doi: 10.1371/journal.pone.0104572. eCollection 2014. PLoS One. 2014. PMID: 25111799 Free PMC article.
-
Neural drive to human genioglossus in obstructive sleep apnoea.J Physiol. 2007 Nov 15;585(Pt 1):135-46. doi: 10.1113/jphysiol.2007.139584. Epub 2007 Oct 4. J Physiol. 2007. PMID: 17916615 Free PMC article.
-
Respiratory motor activity: influence of neuromodulators and implications for sleep disordered breathing.Can J Physiol Pharmacol. 2007 Jan;85(1):155-65. doi: 10.1139/y06-089. Can J Physiol Pharmacol. 2007. PMID: 17487255 Review.
-
Hypoglossal Nerve Stimulation: Effective Longterm Therapy for Obstructive Sleep Apnea.AANA J. 2018 Oct;86(5):412-416. AANA J. 2018. PMID: 31584412 Review.
Cited by
-
Inhomogeneous neuromuscular injury of the genioglossus muscle in subjects with obstructive sleep apnea.Sleep Breath. 2015 May;19(2):539-45. doi: 10.1007/s11325-014-1044-3. Epub 2014 Aug 10. Sleep Breath. 2015. PMID: 25107373
-
Deep learning enhanced transmembranous electromyography in the diagnosis of sleep apnea.BMC Neurosci. 2024 Dec 31;25(1):80. doi: 10.1186/s12868-024-00913-9. BMC Neurosci. 2024. PMID: 39741274 Free PMC article.
-
The ongoing need for good physiological investigation: obstructive sleep apnea in HIV patients as a paradigm.J Appl Physiol (1985). 2015 Jan 15;118(2):244-6. doi: 10.1152/japplphysiol.00656.2014. Epub 2014 Aug 21. J Appl Physiol (1985). 2015. PMID: 25150224 Free PMC article. No abstract available.
-
Effects of aging on genioglossus motor units in humans.PLoS One. 2014 Aug 11;9(8):e104572. doi: 10.1371/journal.pone.0104572. eCollection 2014. PLoS One. 2014. PMID: 25111799 Free PMC article.
-
Respiratory Movement of Upper Airway Tissue in Obstructive Sleep Apnea.Sleep. 2013 Jul 1;36(7):1069-1076. doi: 10.5665/sleep.2812. Sleep. 2013. PMID: 23814344 Free PMC article.
References
-
- Kimoff RJ, Sforza E, Champagne V, Ofiara L, Gendron D. Upper airway sensation in snoring and obstructive sleep apnea. Am J Respir Crit Care Med 2001;164:250–255 - PubMed
-
- Nguyen AT, Jobin V, Payne R, Beauregard J, Naor N, Kimoff RJ. Laryngeal and velopharyngeal sensory impairment in obstructive sleep apnea. Sleep 2005;28:585–593 - PubMed
-
- Friberg D. Heavy snorer's disease: a progressive local neuropathy. Acta Otolaryngol 1999;119:925–933 - PubMed
Publication types
MeSH terms
Grants and funding
LinkOut - more resources
Full Text Sources
