. 2011 Oct 19;31(42):14861-70.
doi: 10.1523/JNEUROSCI.2269-11.2011.

Ivy and neurogliaform interneurons are a major target of μ-opioid receptor modulation

Affiliations

Ivy and neurogliaform interneurons are a major target of μ-opioid receptor modulation

Esther Krook-Magnuson et al. J Neurosci. .

Abstract

μ-Opioid receptors (μORs) are selectively expressed on interneurons in area CA1 of the hippocampus. Fast-spiking, parvalbumin-expressing, basket cells express μORs, but circumstantial evidence suggests that another major, unidentified, GABAergic cell class must also be modulated by μORs. Here we report that the abundant, dendritically targeting, neurogliaform family of cells (Ivy and neurogliaform cells) is a previously unrecognized target of direct modulation by μORs. Ivy and neurogliaform cells are not only numerous but also have unique properties, including promiscuous gap junctions formed with various interneuronal subtypes, volume transmission, and the ability to produce a postsynaptic GABA(B) response after a single presynaptic spike. Using a mouse line expressing green fluorescent protein under the neuropeptide Y promoter, we find that, across all layers of CA1, activation of μORs hyperpolarizes Ivy and neurogliaform cells. Furthermore, paired recordings between synaptically coupled Ivy and pyramidal cells show that Ivy cell terminals are dramatically inhibited by μOR activation. Effects in Ivy and neurogliaform cells are seen at similar concentrations of agonist as those producing inhibition in fast-spiking parvalbumin basket cells. We also report that Ivy cells display the recently described phenomenon of persistent firing, a state of continued firing in the absence of continued input, and that induction of persistent firing is inhibited by μOR activation. Together, these findings identify a major, previously unrecognized, target of μOR modulation. Given the prominence of this cell type in and beyond CA1, as well as its unique role in microcircuitry, opioid modulation of neurogliaform cells has wide implications.


Figures

Figure 1.
Figure 1.
Ivy and neurogliaform cells are modulated by μORs. Ivy and neurogliaform cells were targeted for recordings using an NPY–GFP mouse line. A, A reconstructed Ivy cell (left) whose soma was located in the stratum pyramidale (sp). This cell expressed GFP (green) but did not show immunoreactivity for PV (red) (right, top). Right, Bottom, Response to hyperpolarizing and depolarizing current steps. B, A reconstructed NGF cell, located at the border between stratum radiatum (sr) and stratum lacunosum-moleculare (slm). C, Comparison of currents induced by DAMGO (an μOR-selective agonist) in reelin immuno-negative (black bar; example cell, top left) and reelin immuno-positive (white bar; example cell, top right) neurogliaform family cells and shifts seen in neurogliaform family cells in response to application of DAMGO in the presence of TTX, DAMGO for slices from an adult animal (postnatal day 214), CTAP (an μOR-selective antagonist), DAMGO in the presence of CTAP, DAMGO for slices taken from μOR knock-out mice, and the δOR agonist Deltorphin II (gray bars). D, An example (same cell as in A) of the desensitizing outward current produced by the application of the DAMGO (1 μm, black bar). For clarity, artifacts have been removed. Scale bars: A, B, left, 50 μm; A, B, right top, 10 μm; C, 10 μm. Calibration: A, B, bottom right, 20 mV or 80 pA, 200 ms; D, 200 pA, 100 s.
Figure 2.
Figure 2.
Neurogliaform family interneurons and PV basket cells have similar DAMGO sensitivity. A, In current clamp, application of 1 μm DAMGO (black bar) hyperpolarizes (left trace) the cell. This cell expressed GFP (under the NPY promoter) and showed immunoreactivity for nNOS (bottom) and displayed an LS firing pattern (right traces). Note that, at higher current injections, after the cell had fired many action potentials, persistent firing was induced (see also Fig. 4 and related text). This cell was recorded from the NPY–GFP mouse line. B, Application of 1 μm DAMGO produces a similar, desensitizing, hyperpolarization in an FS basket cell expressing tdTomato (TOM). This cell was recorded from the PV–TOM mouse line. Note that the apparent rhythmicity in the response seen for this cell in the presence of DAMGO was observed in 3 of 11 PV–TOM basket cells. For clarity, in A and B, artifacts have been removed. Bottom, Reconstruction of this FS PV-expressing basket cell. C, DAMGO-induced hyperpolarization by cell type (PV basket cells, squares; NGF/Ivy, circles) and mouse line (hashed bars, NPY–GFP crossed with PV–TOM). Note that the distributions of PV and NPY cell responses showed substantial overlap (red squares vs green circles, each symbol represents the response of an individual cell). For each cell type, there was no difference in baseline shift between mouse strains (NS). PV basket cells showed significantly larger shifts in membrane potential than NGF/Ivy cells (asterisk). D, Voltage-clamp recordings of DAMGO-induced shifts in holding current in rat (R) and in mouse (M) for both NGF/Ivy (green, left 2 bars) and PV basket (red, right 2 bars) cells. E, In rat (triangles) and in mouse (circles and squares), PV basket cells (red symbols) had smaller input resistances and greater DAMGO-induced shifts in holding current than NGF/Ivy cells (green symbols). These distributions were non-overlapping (dotted lines). F, In mouse, responsiveness to a range of DAMGO concentrations was tested in voltage clamp on PV basket cells and NGF/Ivy cells and normalized to the average response per cell type to 1 μm DAMGO. The resulting dose–response curves (solid lines) were not significantly different. Each symbol represents the response of an individual cell (each cell was tested at only one concentration). Green circles, LS NGF/Ivy cells; red squares, FS basket cells. Error bars indicate SEM; *p < 0.05; NS, not significant. sp, stratum pyramidale; sr, stratum radiatum; Calibration: A, B: shifts in membrane potential: 2 mV, 200 s; A, B, response to current steps: 200 ms, 2 mV or 400 pA (A) or 800 pA (B). Scale bar: B, basket cell reconstruction, 50 μm.
Figure 3.
Figure 3.
Neurotransmission from Ivy cells is inhibited by DAMGO. A, In paired recordings between a presynaptic Ivy cell and a postsynaptic pyramidal cell, 1 μm DAMGO produced a strong inhibition of the IPSC. Shown on top is the presynaptic action potential and on bottom the postsynaptic response (gray, 20 individual sweeps; black, average) before drug addition, in the presence of DAMGO (1 μm), and after the addition of CTAP (500 nm) for a representative pair. Right, Overlay of the average response before drug (black), in DAMGO (blue), and after the addition of CTAP (red). Bottom left, The presynaptic cell (asterisk) expressed GFP (under the NPY promoter) and showed immunoreactivity for nNOS. Bottom right, Summary graph illustrating individual paired recordings (gray circles) and the average euIPSCs (black, error bars indicate SEM) per condition. B, In a subset of experiments, 1 μm DAMGO was applied for minutes before application of CTAP. Shown is an example pair for this, before drug addition (a, black trace in overlay), in DAMGO (b, blue trace in overlay), in the continued presence of DAMGO (c, gray trace in overlay), and after the addition of CTAP (d, red trace in overlay). Bottom left, The presynaptic cell (asterisk) expressed GFP and showed immunoreactivity for nNOS. The biocytin-filled postsynaptic pyramidal cell (p) is also visible. Bottom middle, Reconstruction of the presynaptic Ivy cell (dendrites black, axon red) and postsynaptic pyramidal cell (dendrites blue, axon gray). Bottom right, Time course of euIPSC amplitude and drug application. Note that the euIPSC amplitude remains depressed in the continued presence of DAMGO. C, In a separate set of experiments, CTAP was applied before 1 μm DAMGO application. Top, An example pair before drug addition (black in overlay), in the presence of CTAP (red in overlay), and after the addition of DAMGO (blue in overlay). Bottom left, The presynaptic Ivy cell (asterisk) expressed GFP and showed immunoreactivity for nNOS. The postsynaptic pyramidal cell is marked (p). Bottom right, Individual pairs (gray) and average (black) euIPSC amplitude per condition. D, In paired recordings between a presynaptic PV–TOM basket cell and a postsynaptic pyramidal cell, DAMGO inhibits the IPSC. Top, An example pair before drug addition (black in overlay), in the presence of 1 μm DAMGO (blue in overlay), and after the addition of CTAP (red in overlay). Bottom left, Summary graph illustrating individual paired recordings (gray circles), at 1 μm DAMGO concentration, and the average euIPSCs (black, error bars indicate SEM). Bottom right, Percentage reduction of the euIPSC amplitude from pairs with presynaptic NPY Ivy cells (green) or presynaptic PV basket cells (red) at 1 and 0.05 μm DAMGO concentrations. so, Stratum oriens; sp, stratum pyramidale; sr, stratum radiatum. Calibration: A–C, 10 ms, 10 pA or 10 mV; D, 10 ms, 10 mV or 50 pA. Scale bars: A–C, 10 μm; B, reconstruction, 50 μm.
Figure 4.
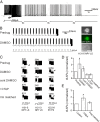
Figure 4.
Ivy cells display persistent firing, and induction of persistent firing is inhibited by DAMGO. A, Median duration of persistent firing seen in Ivy cells after increasing depolarizing current steps (only the last current step is shown). Note the apparent hyperpolarized action potential threshold at the start of persistent firing (arrow), typical of persistent firing. B, After repeated current steps, another Ivy cell displays persistent firing. In the presence of DAMGO (1 μm), induction of persistent firing is delayed. Right, This cell expressed GFP and showed immunoreactivity for nNOS. C, Responses to final depolarizing steps before persistent firing for three example cells, including two Ivy cells (cell 1131-5 is shown also in B) and one PV basket cell. Shown is before drug addition, in DAMGO, in the continued presence of DAMGO, with the addition of CTAP, and finally with somatic hyperpolarization to match that seen initially in DAMGO (labeled as “Vm matched”). Note that, in all cases, DAMGO increased the number of action potentials required to induce persistent firing (small numbers above current-clamp traces). Note also that the number of spikelets (arrows) in the FS PV basket cell increased in DAMGO and with direct somatic hyperpolarization to match the membrane potential seen in DAMGO. D, Summary graph of the number of action potentials (APs) required to induce persistent firing per condition, normalized to that required before drug addition (n = 6 cells). E, The effect of strong somatic hyperpolarization (−150 pA) on the number of action potentials required to induce persistent firing (n = 11 cells). The depolarizing step was increased by 150 pA to compensate, but a decrease in firing frequency was still observed. Therefore, after the strong hyperpolarization was removed, the step size was decreased to match the average firing frequency observed during strong hyperpolarization (“Freq matched”). On two occasions (once with DAMGO application and once with strong hyperpolarization), the inhibition of persistent firing induction was so strong that persistent firing was not induced even after 100 depolarizing current steps; for analysis purposes, the number of action potentials fired during these 100 sweeps was used. *p < 0.05, Wilcoxon's signed ranks test. Scale bar: B, 10 μm. Calibration: C, 20 mV, 1 s.

Similar articles

Cited by

References

    1. Alle H, Geiger JR. Combined analog and action potential coding in hippocampal mossy fibers. Science. 2006;311:1290–1293. - PubMed
    1. Armstrong C, Szabadics J, Tamás G, Soltesz I. Neurogliaform cells in the molecular layer of the dentate gyrus as feed-forward gamma-aminobutyric acidergic modulators of entorhinal-hippocampal interplay. J Comp Neurol. 2011;519:1476–1491. - PMC - PubMed
    1. Ascoli GA, Alonso-Nanclares L, Anderson SA, Barrionuevo G, Benavides-Piccione R, Burkhalter A, Buzsáki G, Cauli B, Defelipe J, Fairén A, Feldmeyer D, Fishell G, Fregnac Y, Freund TF, Gardner D, Gardner EP, Goldberg JH, Helmstaedter M, Hestrin S, Karube F, et al. Petilla terminology: nomenclature of features of GABAergic interneurons of the cerebral cortex. Nat Rev Neurosci. 2008;9:557–568. - PMC - PubMed
    1. Bacci A, Huguenard JR, Prince DA. Differential modulation of synaptic transmission by neuropeptide Y in rat neocortical neurons. Proc Natl Acad Sci U S A. 2002;99:17125–17130. - PMC - PubMed
    1. Bellmann R, Widmann R, Olenik C, Meyer DK, Maas D, Marksteiner J, Sperk G. Enhanced rate of expression and biosynthesis of neuropeptide Y after kainic acid-induced seizures. J Neurochem. 1991;56:525–530. - PubMed

Publication types

MeSH terms