. 2011 Oct 19;31(42):14944-51.
doi: 10.1523/JNEUROSCI.1046-11.2011.

Time-limited consolidation and task interference: no direct link

Affiliations

Time-limited consolidation and task interference: no direct link

Marin Been et al. J Neurosci. .

Abstract

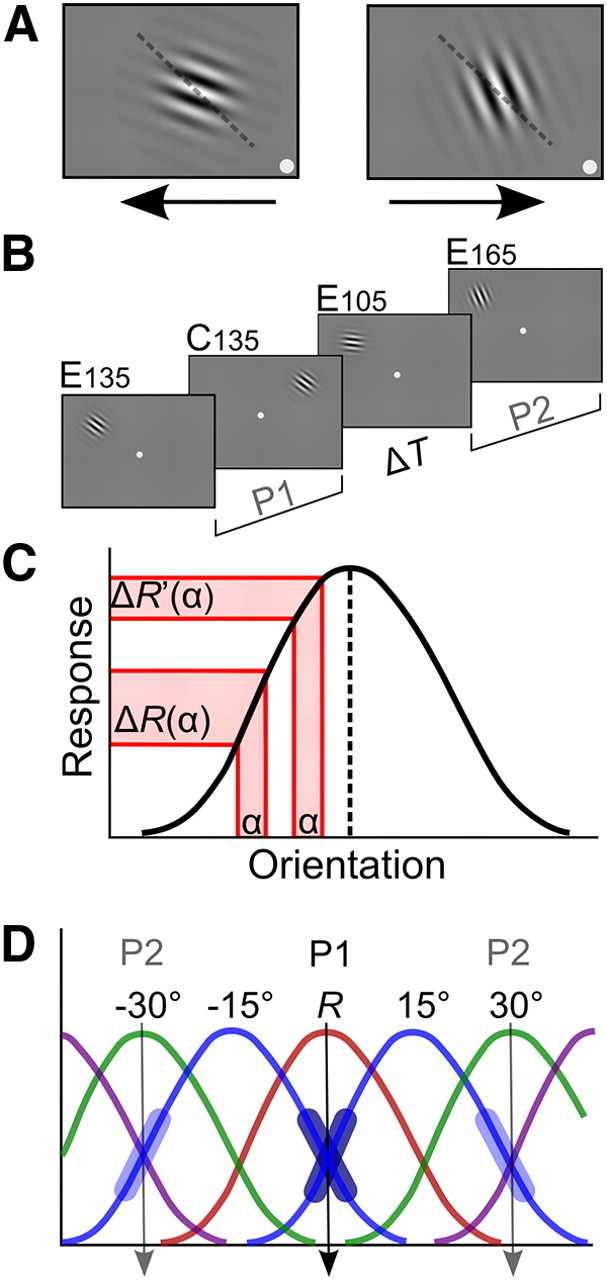
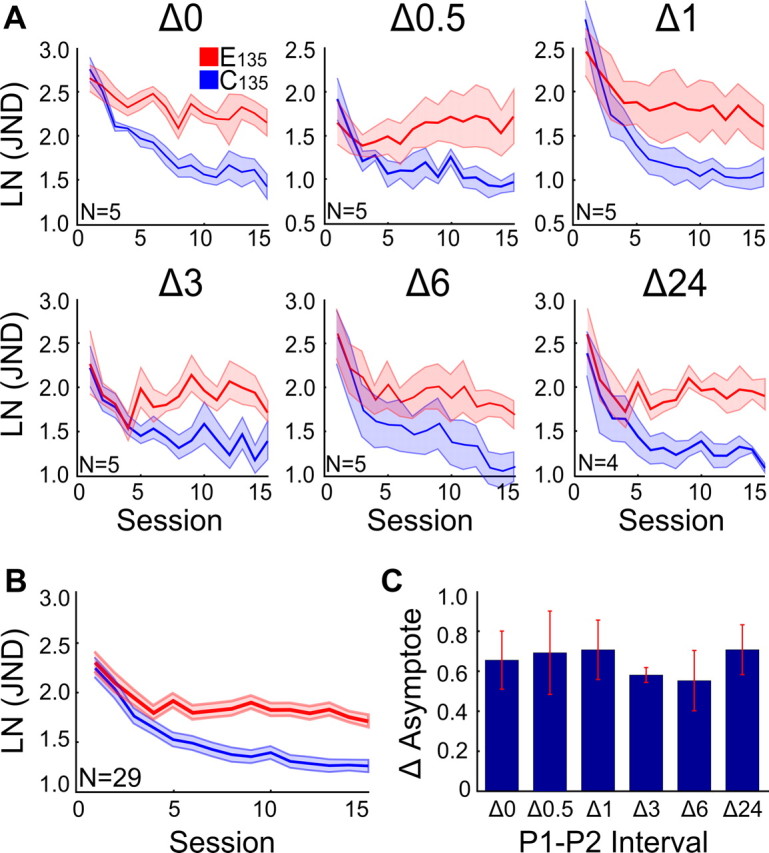
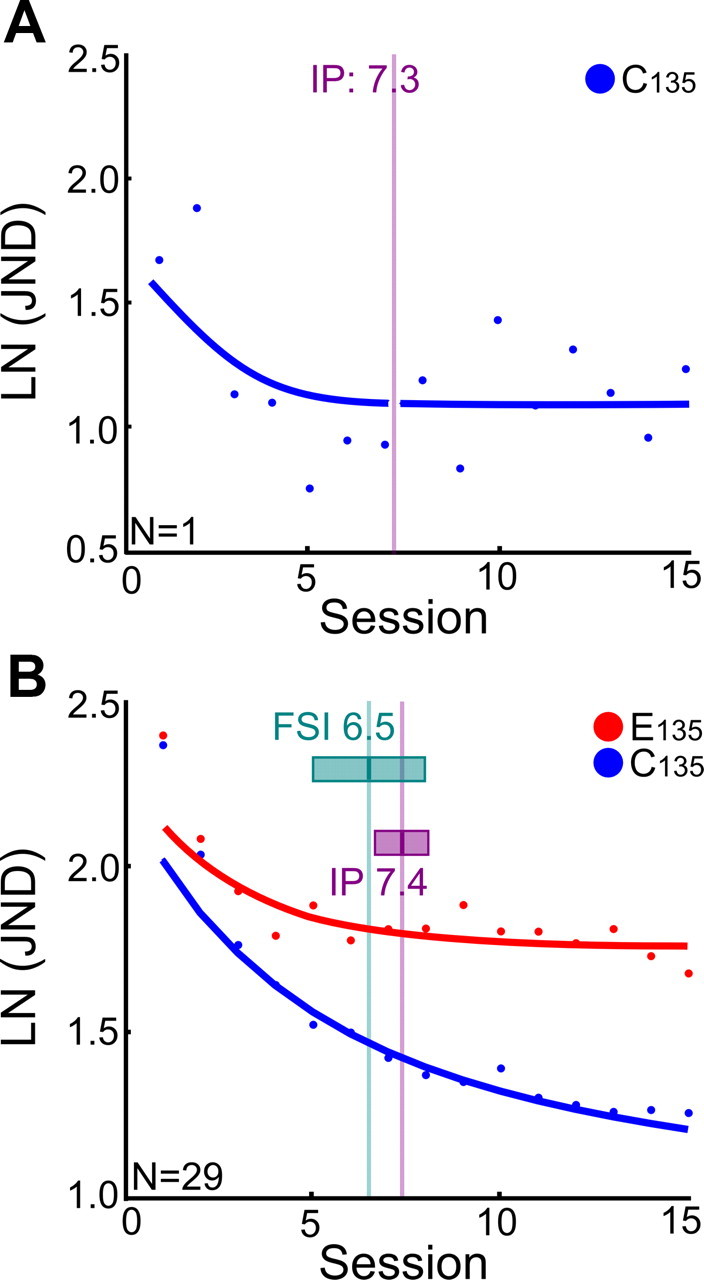
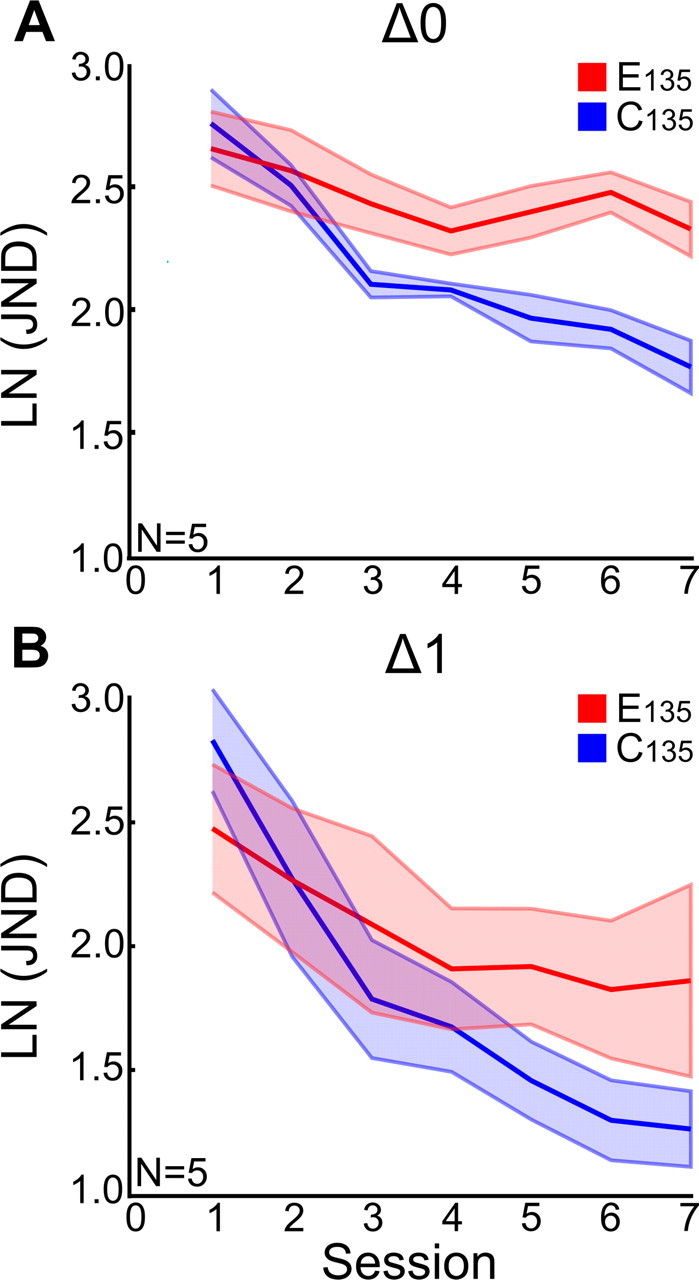
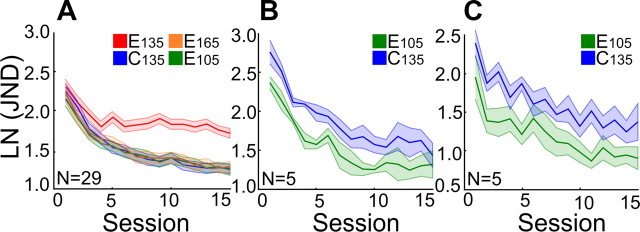
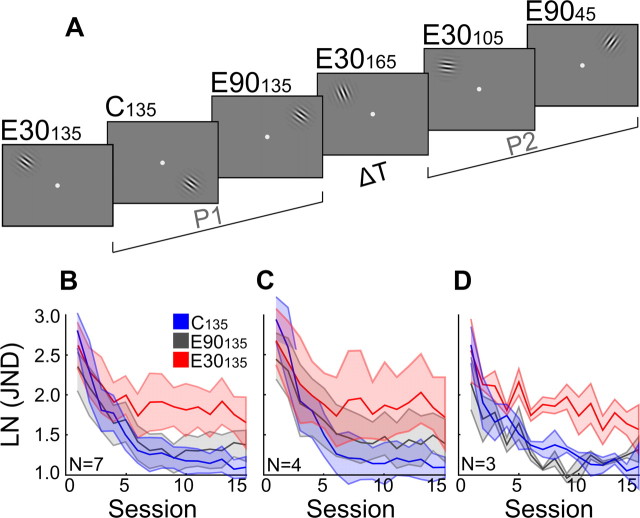
Perceptual skills improve with daily practice (Fahle and Poggio, 2002; Fine and Jacobs, 2002). Practice induces plasticity in task-relevant brain regions during an "offline" consolidation period thought to last several hours, during which initially fragile memory traces become stable (Karni, 1996; Dudai, 2004). Impaired retention of a task if followed by training in another task is considered evidence for the instability of memory traces during consolidation (Dudai, 2004). However, it remains unknown when after training memory traces become stable and resistant against interference, where in the brain the neuronal mechanisms responsible for interference are localized, and how these mechanisms produce interference. Here, we show in human participants strong interference between two visual skill-learning tasks for surprisingly long time intervals between training periods (up to 24 h). Interference occurred during asymptotic learning, but only when stimuli were similar between tasks. This supports a strong contribution to interference of low-level visual cortical areas (Karni and Bertini, 1997; Ahissar and Hochstein, 2004), where similar stimuli recruit overlapping neuronal populations. Our finding of stimulus-dependent and time-independent interference reveals a fundamental limit in cortical plasticity that constrains the simultaneous representation of multiple skills in a single neuronal population, rather than a time-limited consolidation process.


Figures

Figure 1.
Figure 1.
ODT and training-induced tuning changes in single neurons. A, Gabor stimuli and task. Participants fixated in the center of the screen while covertly attending the Gabor patch in an upper (left/right) quadrant of the visual field. Participants indicated the clockwise or anticlockwise deviation of the stimulus relative to a never-presented reference (in this case 135°; dashed line shows reference for illustrative purposes) by pressing the right or left arrow key on a computer keyboard. Feedback was given by a change in color of the fixation dot (green, correct; red, incorrect). Trials with fixation errors (>1.5° from fixation) were aborted (Arrington Research), and 84% correct staircase JNDs were determined (implemented in CORTEX 5.9.6, NIH freeware). B, Testing paradigm. Participants were tested in four conditions (4 JNDs of ∼100 trials per condition). In training period P1 participants were trained at a 135° reference orientation in upper left and right quadrant. One upper quadrant served as a control (C135). The other was the experimental quadrant (E135), where P1 training after a variable time interval of rest (ΔT) was followed by training in a second period P2 at reference orientations 105° (E105) and 165° (E165). C, Tuning curve of an orientation selective cell is most discriminative at its flanks. A difference α between two orientations on the flanks of the tuning curve will yield a differential response ΔR(α) that is larger than the differential response ΔR′(α) yielded by the same difference between two orientations closer to the neuron's preferred orientation (dashed line). D, Our experimental design is informed by prior research showing that extensive training in orientation discrimination invoking asymptotic performance (Vogels and Orban, 1985; Schoups et al., 1995) selectively modified flank slopes of tuning curves in V1 and V4 neurons (Schoups et al., 2001; Raiguel et al., 2006). As V1 neurons are more narrowly tuned to orientation (David et al., 2006), and are probably more crucial during final asymptotic performance, we used V1 tuning properties to predict conditions of behavioral interference. In a V1 population neurons with tuning curve peaks about 15° away (blue curves) from a trained reference orientation R (135°) (red curve) sharpen their tuning curve flanks (fat dark blue line segments) overlapping with the reference orientation. Extrapolating this idea, we predicted that following up P1 training at the reference orientation R with subsequent, P2 training at R ± 30° (green curves) would cause interference with training at R. P1 training at R and subsequent P2 training at R ± 30° both require plasticity in neurons with preferred orientations at R ± 15°, P1 training should increase the slope of flanks in tuning curves overlapping with R, and P2 training the slope of flanks overlapping with the +30° and −30° orientations (fat light blue line segments). We hypothesized that one requirement would counteract the other, leading to behavioral interference at R [P2 training is also expected to lead to steepening of flanks of ±45° neurons' tuning curves (in purple)].
Figure 2.
Figure 2.
Behavioral interference during asymptotic learning. A, Interference for six different intervals between training period 1 (P1) and training period 2 (P2) (Δ0–Δ24 h). Each panel (corresponding to one interval) shows the natural logarithm of the just noticeable difference [LN(JND)] plotted as a function of session in experimental quadrant (red line) and control quadrant (blue line). For all intervals except the 24 h interval, P1 and P2 training were completed on the same day. In the Δ24 h condition, P1 and P2 training were alternated from day to day, and a session therefore took 2 d (testing took 30 d). B, Data averaged over P1–P2 intervals. C, Difference between learning curve asymptotes (ΔAsymptote in ln units) in experimental and control quadrant averaged over the last eight sessions. A one-way ANOVA showed that there was no significant difference in the size of ΔAsymptote between intervals (F(5,23) = 0.22, p = 0.951). Shaded red and blue regions and error bars are standard errors; numbers in top right corner represent N participants (conventions are similar for all figures).
Figure 3.
Figure 3.
Significant interference starts at asymptotic learning. A, Illustration of the procedure to determine the beginning of asymptotic learning for the control condition at reference orientation 135° (C135) in a single participant. The beginning of asymptotic learning was defined as the IP of the learning curve. To determine the IP, we used a piecewise nonlinear regression fitting procedure (see Materials and Methods). The results of optimized nonlinear and linear fitting as well as the optimized transition point (the IP; vertical gray line) are shown. The IP was determined for all intervals between the first (P1) and second (P2) training periods for the C135 condition, and the resulting IP (29 participants) was on average at session 7.4. B, Comparison of the average inflection point with the average session in the course of learning at which the FSI is observed. The figure shows the data for the control condition C135 (blue dots) and the experimental condition E135 (red dots). For both conditions, the data were averaged over the different P1–P2 intervals (0, 0.5, 1, 3, 6, 24 h), as these experimental conditions did not significantly differ from each other. The fitted curves represent the average result of piecewise fitting for C135 (blue) and E135 (red). The vertical lines respectively mark the average session of FSI (green line) and average inflection point of the control condition C135 (IP, purple line) corresponding to the point at which initial fast learning is replaced with later asymptotic learning. While IP was based on estimates within each of 29 individuals, FSI was estimated in six groups of participants corresponding to the different P1–P2 delay conditions. The FSI was the first session in which paired-samples t tests between the JNDs from E135 and C135 showed a statistically significant difference. Averaged over the six P1–P2 delay conditions, this occurred at session 6.5. The two horizontal boxes show the size of the 95% confidence intervals, for both FSI and IP. Their overlap indicates that the distribution and the averages of the FSI and IP are not significantly different. In addition, a t test between the FSI and IP for the six different P1–P2 intervals showed that the average FSI is not significantly different from the average IP (t = −1.7399, df = 5, p = 0.1424; paired).
Figure 4.
Figure 4.
Comparing the fast learning part of the learning curves between the different P1–P2 intervals does not reveal time-limited consolidation. Here, a comparison of fast learning is shown at the Δ0 h (A) and Δ1 h intervals (B). A, The first seven sessions for the E135 and C135 conditions in the Δ0 h P1–P2 interval, up to the average IP. B, The first seven sessions for the Δ1 h interval. These plots show the two intervals that are comparable to the intervals used in the paper of Seitz et al. (2005), who found time-dependent behavioral interference between two Vernier tasks during early learning. A repeated-measures ANOVA on our data [Condition (E135, C135) × Session (7) × P1–P2 Interval (Δ0 h, Δ1 h)] failed to find a significant interaction between Condition and Interval (F(1,8) = 0.330, p = 0.581). Also, for redundancy, a comparison was made between Δ0 with all other P1–P2 intervals in a combined repeated-measures ANOVA; again, the interaction between Condition and Interval was not significant (F(5,23) = 0.374, p = 0.861).
Figure 5.
Figure 5.
Stimulus dependency of behavioral interference. A, Interference is asymmetric. P2 training of E105 and E165 delays P1 training of E135, but not vice versa. Learning curves for E105 and E165 are indistinguishable from learning curves for C135. B, Data of the five subjects from the Δ0 h P1–P2 interval on the C135 and E105 conditions from the original experiment. C, Data for the same five subjects after extra training on new C135 and E105 conditions in the new, control experiment in which training at the 105° reference orientation could not have suffered from interference. To analyze whether the E105 performance was comparable in original (B) and control (C) experiments, a repeated-measures ANOVA [Experiment (original, control) × Condition (C135, E105) × Session (15)] was carried out. This analysis indicated that the Condition × Experiment interaction was not significant (F(1,8) = 1.501, p = 0.255). Thus, the performance on the E105 condition was similar in both experiments, thereby supporting the conclusion that training at the 105° and 165° reference orientations was not interfered with by training at the 135° reference orientation in the same visual field position.
Figure 6.
Figure 6.
Double training does not cause behavioral interference. A, Experimental design used to replicate interfering effects of two blocks of training in P2 at reference orientations that differ by 30° from 135° (C30135 in P1, E30105 and E30165 in P2), and to compare these with interfering effects of a single block or two blocks in P2 at a reference orientation differing by 90° from 135° (E90135 in P1, E9045 in P2). Thus, while each stimulus display in Figure 6A corresponds to four JNDs, display E9045 was tested in either four or eight JNDs. The number following “E” refers to the orientation difference between reference orientations used during P1 and P2 training in the same location. B, Training in orientation discrimination with orthogonal reference orientations during P1 and P2 does not cause behavioral interference (N = 7). The figure shows learning curves for P1 training at the 135° reference orientation in the control quadrant (C135), for P1 training at the 135° reference orientation in the experimental quadrant where P2 training was performed with an orthogonal 45° reference (E90135) (either 4 or 8 JNDs), and for P1 training at the 135° reference orientation in the experimental quadrant where P2 training was performed at ±30° references (E30135). Learning curves for E90135 (dark gray) and C135 (blue) overlap. C, Effect of training with a double block (8 JNDs) of P2 training at a 45° reference (E9045) on learning rate in the preceding P1 training condition at 135° (E90135). D, Effect of training with a single block (4 JNDs) of P2 training at a 45° reference (E9045) in otherwise the same experiment. In both datasets, the E90135 condition (dark gray line) is compared with the standard control condition C135 (blue line), and with the standard interference condition E30135 (red line) in which P1 training at 135° was followed by a block (4 JNDs) of P2 training at 105° and a block at 165. A repeated-measures ANOVA [Double-Training (yes, no) × Condition (C135, E90135) × Session (15)] showed that neither the main effect of Condition (F(1,5) = 0.95, p = 0.770) nor the Condition × Double-Training interaction (F(1,5) = 2.946, p = 0.147) was significant.

References

    1. Aberg KC, Herzog MH. Does perceptual learning suffer from retrograde interference? PLoS One. 2010;5:e14161. - PMC - PubMed
    1. Agranoff BW, Davis RE, Brink JJ. Memory fixation in the goldfish. Proc Natl Acad Sci U S A. 1965;54:788–793. - PMC - PubMed
    1. Ahissar M, Hochstein S. The reverse hierarchy theory of visual perceptual learning. Trends Cogn Sci. 2004;8:457–464. - PubMed
    1. Alvarez VA, Sabatini BL. Anatomical and physiological plasticity of dendritic spines. Annu Rev Neurosci. 2007;30:79–97. - PubMed
    1. Appelle S. Perception and discrimination as a function of stimulus orientation—oblique effect in man and animals. Psychol Bull. 1972;78:266–278. - PubMed

Publication types