. 2011 Oct 19;31(42):14972-83.
doi: 10.1523/JNEUROSCI.3226-11.2011.

Dopaminergic modulation of the striatal microcircuit: receptor-specific configuration of cell assemblies

Affiliations

Dopaminergic modulation of the striatal microcircuit: receptor-specific configuration of cell assemblies

Luis Carrillo-Reid et al. J Neurosci. .

Abstract

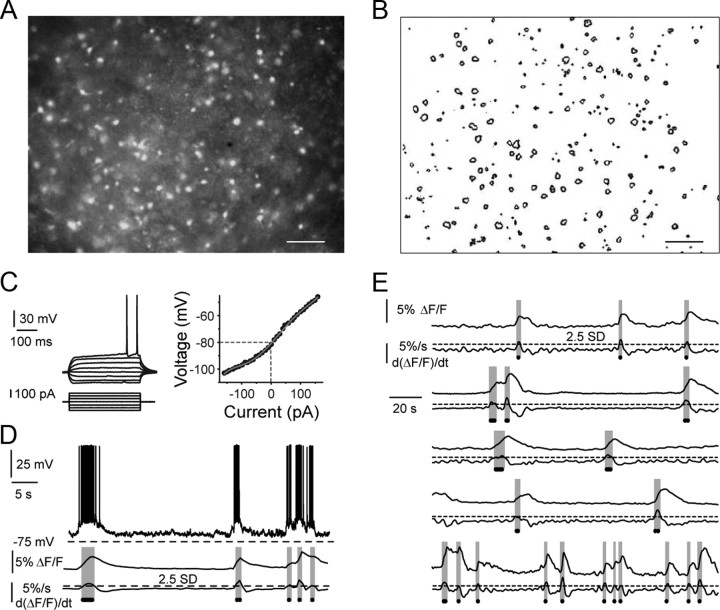
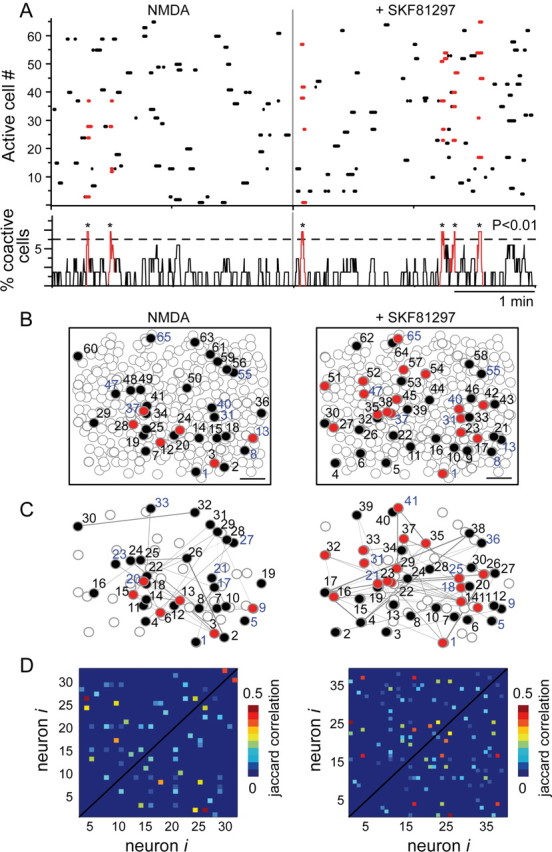
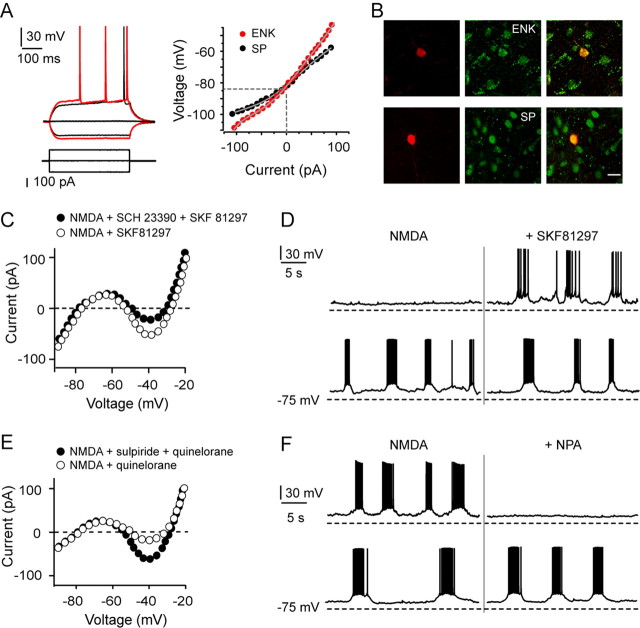
Selection and inhibition of motor behaviors are related to the coordinated activity and compositional capabilities of striatal cell assemblies. Striatal network activity represents a main step in basal ganglia processing. The dopaminergic system differentially regulates distinct populations of striatal medium spiny neurons (MSNs) through the activation of D(1)- or D(2)-type receptors. Although postsynaptic and presynaptic actions of these receptors are clearly different in MSNs during cell-focused studies, their activation during network activity has shown inconsistent responses. Therefore, using electrophysiological techniques, functional multicell calcium imaging, and neuronal population analysis in rat corticostriatal slices, we describe the effect of selective dopaminergic receptor activation in the striatal network by observing cell assembly configurations. At the microcircuit level, during striatal network activity, the selective activation of either D(1)- or D(2)-type receptors is reflected as overall increases in neuronal synchronization. However, graph theory techniques applied to the transitions between network states revealed receptor-specific configurations of striatal cell assemblies: D(1) receptor activation generated closed trajectories with high recurrence and few alternate routes favoring the selection of specific sequences, whereas D(2) receptor activation created trajectories with low recurrence and more alternate pathways while promoting diverse transitions among neuronal pools. At the single-cell level, the activation of dopaminergic receptors enhanced the negative-slope conductance region (NSCR) in D(1)-type-responsive cells, whereas in neurons expressing D(2)-type receptors, the NSCR was decreased. Consequently, receptor-specific network dynamics most probably result from the interplay of postsynaptic and presynaptic dopaminergic actions.


Figures

Figure 1.
Figure 1.
Visualization of striatal microcircuits with single-cell resolution. A, Fluorescent neurons from a striatal slice loaded with the calcium indicator fluo-4 AM. B, Contour detection from loaded cells in A. Scale bar, 100 μm. C, Voltage responses (left) to current steps recorded from an MSN. Current–voltage relationship (right) measured in current-clamp mode. D, Simultaneous electrophysiological (top) and calcium imaging (middle) recordings taken from a medium spiny neuron that displayed bursting activity after the application of 8 μm NMDA. The duration of the positive region of the first time derivative of the calcium transients (bottom) matches the duration of the up states sustaining bursts of action potentials (gray stripes). Dots indicate bursting events in which the first derivative of the calcium transients is >2.5 times the SD of the noise. E, Calcium transients and first time derivatives from five neurons recorded simultaneously in the presence of 8 μm NMDA. Note that differentiated calcium transients reflect, indirectly, the up and down bursting activity of MSNs as that shown in D.
Figure 2.
Figure 2.
D1-class receptor modulation of striatal microcircuit activity. A, Raster plot of network activity induced by 8 μm NMDA before and after D1-class receptor activation. Spontaneous peaks of synchrony (red) reflecting network activity increase during 5 μm SKF 81297 exposure (p < 0.01). Peaks of synchronous activity are in red. Note that synchronous activity increases after activation of D1-class receptors. B, Spatial maps of neurons involved in striatal network activity (filled circles). Open contours represent loaded cells that were not active during recording time. Blue numbers indicate neurons active in both conditions. Scale bar, 100 μm. C, Spatial correlation maps of network activity. Lines indicate neurons with correlated firing in the epoch illustrated. Red circles signal the neurons participating in the peaks of synchrony (numbers correspond to pseudocolored maps from D). D, Pseudocolored maps showing all neurons with correlated firing. The number of correlated neurons increased significantly after D1-class receptor activation (p < 0.01), although the number of active cells remains without a significant increase.
Figure 3.
Figure 3.
D2-class receptor modulation of striatal microcircuit activity. A, Raster plot of network activity induced by 8 μm NMDA before and after D2-class receptor activation. Spontaneous peaks of synchrony (red) reflecting network activity increase during 5 μm quinelorane exposure (p < 0.04). Peaks of synchronous activity are in red. Note that network synchrony increases. B, Spatial maps of neurons involved in striatal network activity (filled circles). Open contours represent loaded cells that were not active during recording time. Blue numbers indicate neurons active in both conditions. Scale bar, 100 μm. C, Spatial correlation maps of network activity. Lines indicate neurons with correlated firing in the epoch illustrated. Red circles signal the neurons participating in the peaks of synchrony (numbers correspond to pseudocolored maps from D). D, Pseudocolored maps of all neurons with correlated firing in the field of view. The number of correlated neurons increased significantly after D2-class receptor activation (p < 0.05), although the number of active cells remains without a significant increase.
Figure 4.
Figure 4.
D1 receptor activation generates sequences with high recurrence. A, Similarity map of the vectors representing the network activity as a function of time in the presence of SKF 81297. B, Dimensionality reduction of the vectors representing network dynamics using LLE. Points represent vectors at a given time. Clusters of vectors define different network states. Arrows represent the pathways between network states. The probability to leave a given state is represented by numbers. C, State transitions as a function of time (top). Vertical lines separate different epochs. The sentence of an experiment is given by black numbers. Each number represents a network state. Cyclic folds that fulfill the requirements to be Hamiltonian or Eurelian are indicated with colors. The same colors represent exactly the same cycles. The transitions between the network states can be represented as directed graphs (bottom). Asterisks signal starting points. Percentages indicate the conditional probability for the existence of a specific sequence. Note that the same cycle can be repeated several times in a given experiment. D, Raster plot and time histogram of the network activity in the presence of SKF 81297. Each row represents one active cell. Peaks of synchronous activity that occur above chance are signaled with asterisks. Vertical lines indicate different epochs. Colors denote that the vectors belong to a given network state. E, Spatial maps of the neurons that conform to a given state (filled circles). F, Percentage of coactive cells between different network states. G, Hierarchical cluster analysis of neurons underlying the network states. Colored boxes indicate that a neuron participates in a given state.
Figure 5.
Figure 5.
D2 receptor activation promotes sequences with low recurrence. A, Similarity map of the vectors representing the network dynamics in the presence of quinelorane. B, Multidimensional reduction of the vectors representing network dynamics. Clusters of vectors define network states. Arrows represent the pathways between network states. C, State transitions as a function of time (top). Vertical lines separate different epochs. Each number represents a network state. Cyclic folds are indicated with colors. Directed graphs (bottom) represent the transitions between the network states. Asterisks signal starting points. Percentages indicate the conditional probability for the existence of a specific sequence. Note that filled cycles are diverse and are not repeated several times. In addition, some epochs do not allow a valid (closed) sequence. D, Raster plot and time histogram of the network activity in the presence of quinelorane. Rows represent active neurons. Asterisks signal peaks of synchronous activity. Vertical lines indicate different epochs. Colors denote network states. E, Spatial maps of the neurons that give rise to the network states (filled circles). F, Percentage of coactive cells between different network states. G, Hierarchical cluster analysis of neurons belonging to different network states. Neurons participating in a given state are indicated by colored boxes.
Figure 6.
Figure 6.
Response of medium spiny neurons to D1- and D2-class receptor agonists. A, Superimposed electrophysiological responses from ENK+ (red) and SP+ (black) MSNs to 100 pA current steps (left). Current–voltage relationships in current-clamp mode of both neuron classes are illustrated (right). B, MSNs filled with biocytin (left). Same optical field shows neurons immunoreactive for ENK or SP (middle) and double-labeled neurons (overlaid) for biocytin and peptides (right) using confocal microscopy. Scale bar, 20 μm. C, Current–voltage relationships in voltage-clamp mode show that activation of NMDA receptors induces an NSCR. Activation of D1-type receptors (5 μm SKF 81297) increases the NSCR in responsive cells belonging to the direct pathway (SP+). This action was blocked by 1 μm SCH 23390. D, Membrane potential recordings of two different SP+ MSNs (top and bottom) during bath addition of 5 μm SKF 81297 in the presence of NMDA. Note that bursting activity could be induced (top) or not significantly changed (bottom) even if NSCR was increased in both neurons. E, Current–voltage relationships in voltage-clamp mode show that activation of D2-type receptors (5 μm quinelorane) reduces the NSCR from indirect pathway ENK+ MSNs. This action was blocked by 1 μm sulpiride. F, Membrane potential oscillations induced by NMDA in two different ENK+ neurons (top and bottom). Note that, in the presence of a D2-type agonist, 5 μm NPA, the bursting activity could be abolished (top) or enhanced (bottom) even if the NSCR was reduced in both cells.

Similar articles

Cited by

References

    1. Abeles M, Hayon G, Lehmann D. Modeling compositionality by dynamic binding of synfire chains. J Comput Neurosci. 2004;17:179–201. - PubMed
    1. Albin RL, Young AB, Penney JB. The functional anatomy of basal ganglia disorders. Trends Neurosci. 1989;12:366–375. - PubMed
    1. Barnes TD, Kubota Y, Hu D, Jin DZ, Graybiel AM. Activity of striatal neurons reflects dynamic encoding and recoding of procedural memories. Nature. 2005;437:1158–1161. - PubMed
    1. Bateup HS, Santini E, Shen W, Birnbaum S, Valjent E, Surmeier DJ, Fisone G, Nestler EJ, Greengard P. Distinct subclasses of medium spiny neurons differentially regulate striatal motor behaviors. Proc Natl Acad Sci U S A. 2010;107:14845–14850. - PMC - PubMed
    1. Berke JD. Uncoordinated firing rate changes of striatal fast-spiking interneurons during behavioral task performance. J Neurosci. 2008;28:10075–10080. - PMC - PubMed

Publication types

MeSH terms

LinkOut - more resources