. 2011 Oct 19;31(42):14989-97.
doi: 10.1523/JNEUROSCI.2983-11.2011.

Substrate-induced internalization of the high-affinity choline transporter

Affiliations

Substrate-induced internalization of the high-affinity choline transporter

Takashi Okuda et al. J Neurosci. .

Abstract

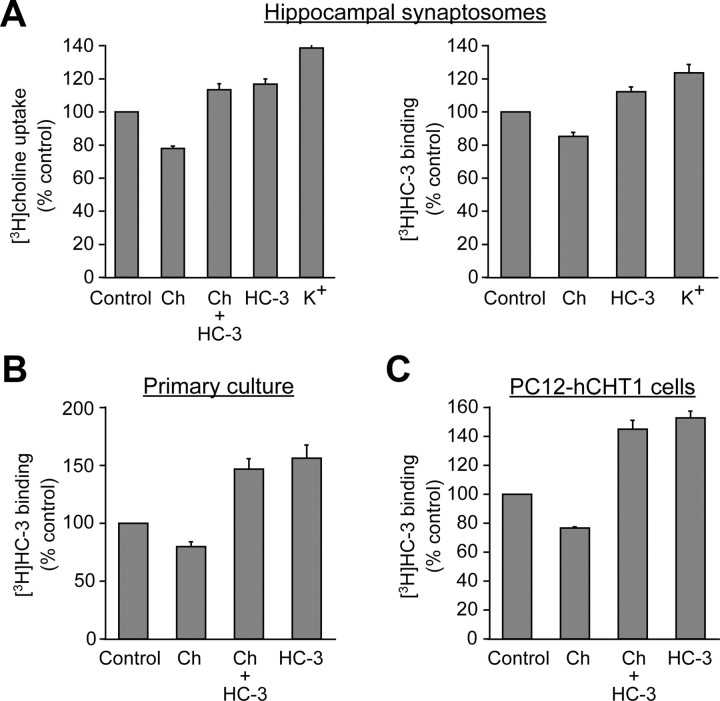
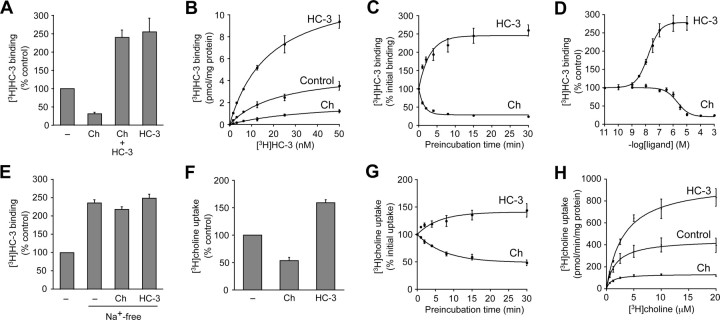
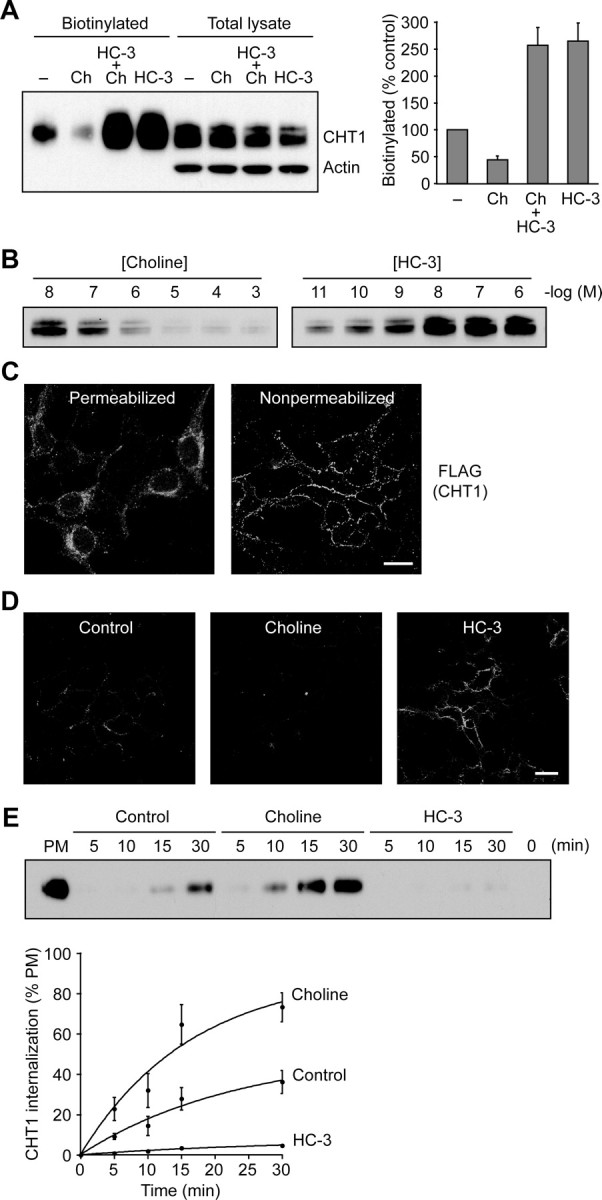
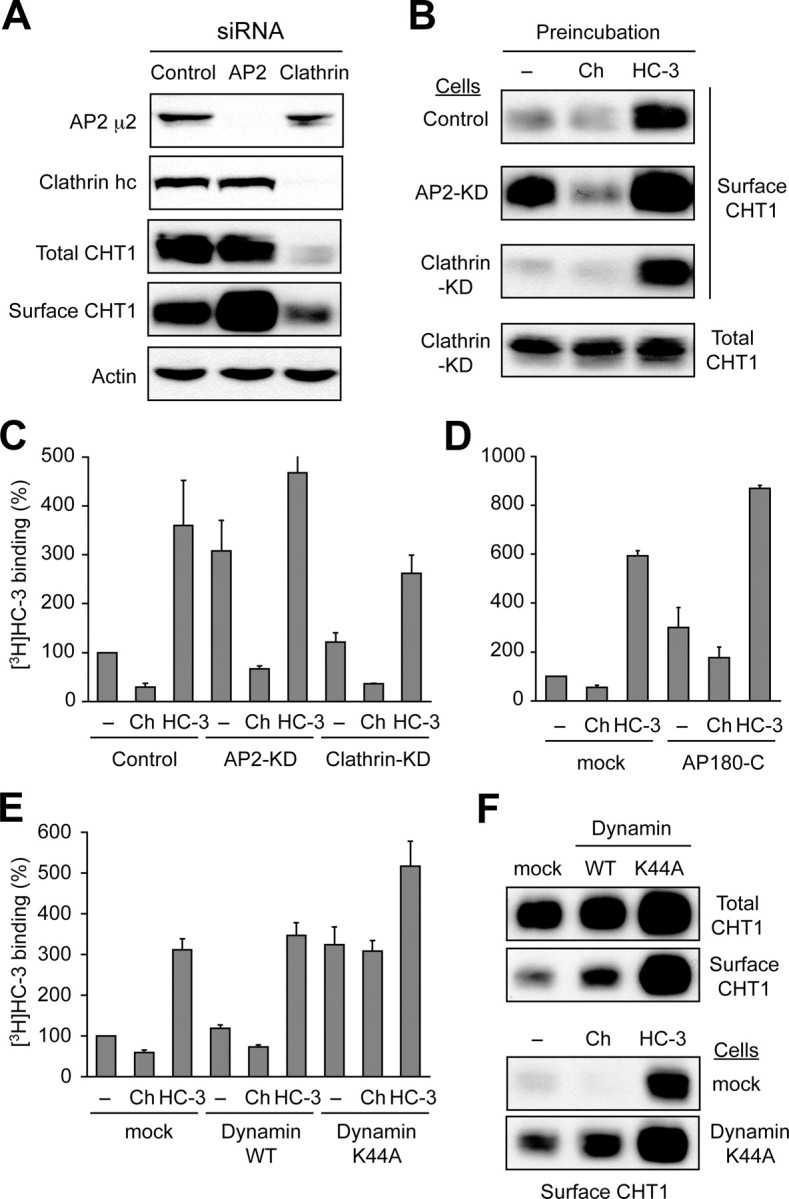
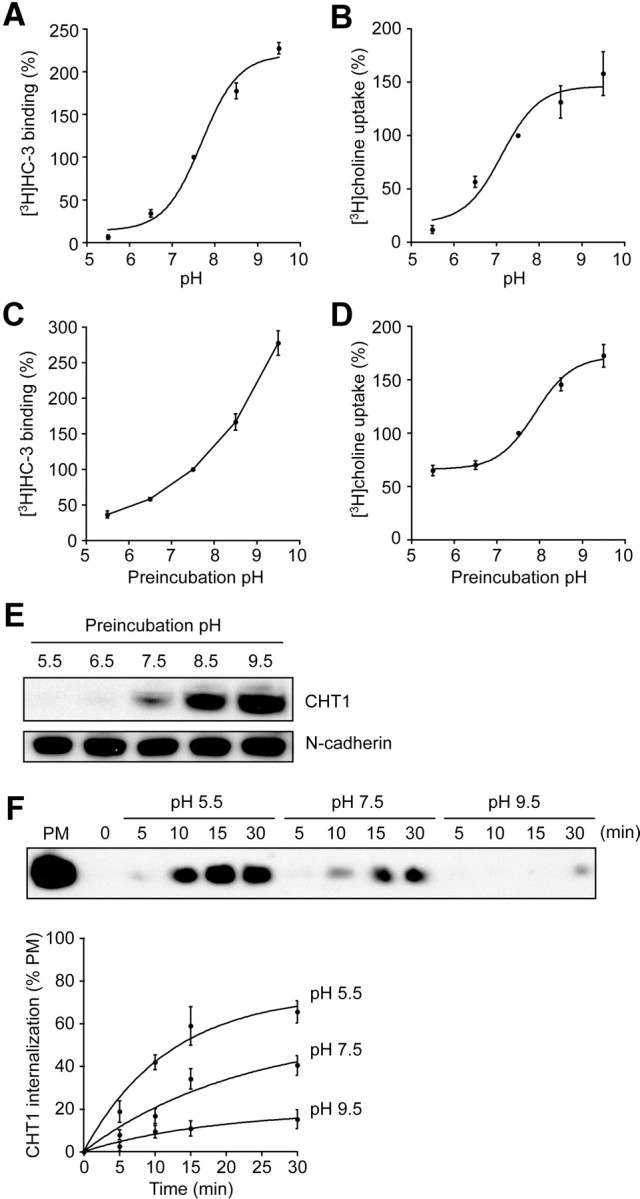
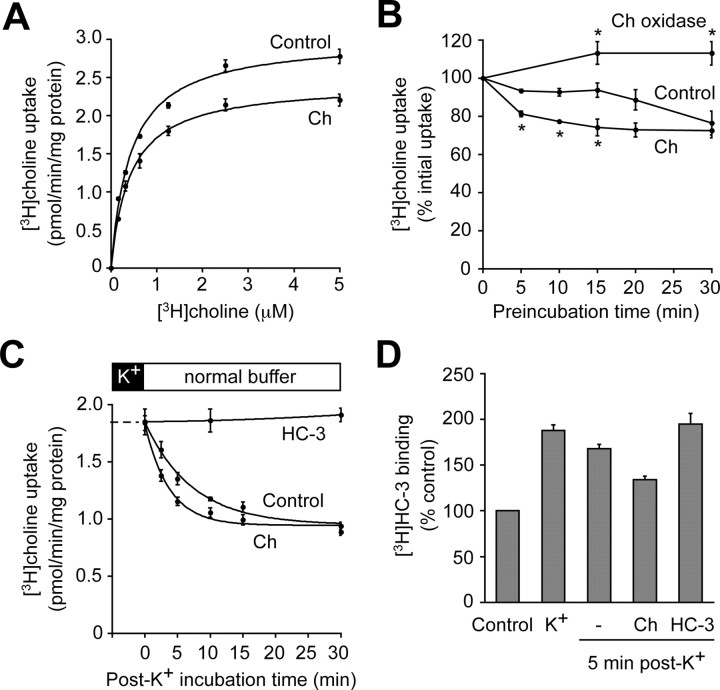
Cholinergic neurons are endowed with a high-affinity choline uptake system for efficient synthesis of acetylcholine at the presynaptic terminals. The high-affinity choline transporter CHT1 is responsible for choline uptake, the rate-limiting step in acetylcholine synthesis. However, endogenous physiological factors that affect CHT1 expression or function and consequently regulate the acetylcholine synthesis rate are essentially unknown. Here we demonstrate that extracellular substrate decreases the cell-surface expression of CHT1 in rat brain synaptosomes, primary cultures from the basal forebrain, and mammalian cell lines transfected with CHT1. Extracellular choline rapidly decreases cell-surface CHT1 expression by accelerating its internalization, a process that is mediated by a dynamin-dependent endocytosis pathway in HEK293 cells. Specific inhibitor hemicholinium-3 decreases the constitutive internalization rate and thereby increases cell-surface CHT1 expression. We also demonstrate that the constitutive internalization of CHT1 depends on extracellular pH in cultured cells. Our results collectively suggest that the internalization of CHT1 is induced by extracellular substrate, providing a novel feedback mechanism for the regulation of acetylcholine synthesis at the cholinergic presynaptic terminals.


Figures

Figure 1.
Figure 1.
Preincubation with choline or hemicholinium-3 regulates [3H]choline uptake or [3H]HC-3 binding in brain synaptosomes or cultured cells expressing hCHT1. A, [3H]Choline uptake (left) or [3H]HC-3 binding (right) in rat hippocampal synaptosomes after preincubation with 10 μm choline (Ch) and/or 1 μm HC-3 for 15 min. Preincubation with high K+ (50 mm) buffer for 15 min also increased [3H]choline uptake (139 ± 4%, p < 0.01; n = 4) or [3H]HC-3 binding. B, [3H]HC-3 binding in primary cultures from the rat basal forebrain (DIV12–14) after preincubation with 10 μm choline and/or 1 μm HC-3. C, [3H]HC-3 binding in PC12 cells transfected with hCHT1 after preincubation with 10 μm choline and/or 1 μm HC-3 for 30 min.
Figure 2.
Figure 2.
Characterization of ligand-induced changes in the hCHT1 cell-surface expression in HEK293 cells. A, [3H]HC-3 binding after preincubation with 20 μm choline (Ch) or 1 μm HC-3 for 30 min in HEK293 cells stably expressing human CHT1. B, Saturation analysis of [3H]HC-3 binding after ligand preincubation (20 μm choline or 1 μm HC-3 for 30 min). C, Time courses of ligand preincubation on [3H]HC-3 binding. Cells were preincubated with ligands at 37°C for the indicated times. Time course curves were fitted to the following functions: (100 − B) + B × exp(−0.693t/t1/2) for choline and 100 + B × (1 − exp(−0.693t/t1/2)) for HC-3. D, The dose-dependent effects of ligand preincubation on [3H]HC-3 binding. Cells were preincubated with indicated ligand concentrations at 37°C for 30 min. E, Na+-dependent effects of ligand preincubation on [3H]HC-3 binding. Cells were preincubated with ligands in Na+-free buffer, in which NaCl was replaced by equimolar LiCl. Under Na+-free conditions, [3H]HC-3 binding was 236 ± 9, 218 ± 7, and 249 ± 11% for control, choline, and HC-3, respectively; p > 0.1 by one-way ANOVA (n = 3). F, CHT1-specific [3H]choline uptake after ligand preincubation. G, Time course of ligand preincubation on [3H]choline uptake. Time course curves were fitted to the following functions: (100 − V) + V × exp(−0.693t/t1/2) for choline and 100 + V × (1 − exp(−0.693t/t1/2)) for HC-3. H, Saturation analysis of [3H]choline uptake after ligand preincubation.
Figure 3.
Figure 3.
Ligand preincubation alters the CHT1 cell-surface expression level by regulating its internalization rate. A, Cell-surface biotinylation assay in 293–hCHT1 cells. After preincubation of cells with 10 μm choline (Ch) and/or 1 μm HC-3, cell-surface proteins were biotinylated by incubating cells with a membrane-impermeable sulfo-NHS-SS-biotin at 4°C. Cell-surface biotinylated proteins (“Biotinylated”) and total proteins (“Total lysate”) were immunoblotted with an antibody against CHT1 or actin. The cell-surface biotinylation specificity was confirmed by depleted actin signals in the biotinylated fractions. The densitometric quantification of the immunoreactive bands is shown on the right. B, Dose-dependent effects of ligand preincubation on the amount of cell-surface biotinylated CHT1. C, Immunofluorescence analysis of 293–FLAG–hCHT1 cells. The cells were permeabilized or not using 0.2% Triton X-100 and subjected to FLAG antibody staining. Note that heterologous expression of CHT1 in mammalian cell lines generally results in predominant intracellular localization and low expression in the plasma membrane (left). Scale bar, 20 μm. D, Cell-surface staining of 293–FLAG–hCHT1 cells after preincubation with 20 μm choline or 1 μm HC-3. Scale bar, 20 μm. E, Internalization of the cell-surface biotinylated CHT1. After cell-surface protein biotinylation, the cells were allowed to complete endocytosis through incubation at 37°C with 20 μm choline or 1 μm HC-3. The biotinylated proteins that were protected from glutathione-mediated cleavage were evaluated by immunoblot analysis using a CHT1 antibody. PM, Plasma membrane fraction that was prepared from cells kept at 4°C without the cleavage. The densitometric analysis for the time courses of CHT1 internalization in the presence of choline or HC-3 is shown in the bottom. The data are normalized to levels observed in the plasma membrane fraction.
Figure 4.
Figure 4.
Choline-induced CHT1 internalization is mediated by a clathrin-independent, dynamin-dependent endocytosis pathway. A, Immunoblot analysis of total cell lysates from 293–hCHT1 cells transfected with siRNAs directed against each target. Equal amounts of protein were subjected to SDS-PAGE, and the blots were probed with the indicated antibodies. In clathrin-depleted cells, the total CHT1 expression level was significantly decreased compared with that in control cells, presumably because clathrin is required for intracellular vesicular trafficking and stable expression of CHT1. Clathrin hc, Clathrin heavy chain. B, Cell-surface biotinylation assay in cells transfected with siRNAs. After preincubation of cells with 20 μm choline (Ch) or 1 μm HC-3, the cell-surface proteins were biotinylated at 4°C. The biotinylated proteins were immunoblotted using a CHT1 antibody. KD, Knockdown. C, [3H]HC-3 binding after ligand preincubation in 293–hCHT1 cells transfected with siRNAs against the proteins related to the clathrin-mediated endocytosis. [3H]HC-3 binding of choline-treated cells relative to that of each control was 30 ± 7, 22 ± 3, and 30 ± 3% for control, AP-2, and clathrin, respectively (p > 0.1 by one-way ANOVA; n = 3). D, [3H]HC-3 binding after ligand preincubation in 293–hCHT1 cells transfected with AP180-C. [3H]HC-3 binding of choline-treated cells was 56 ± 5 and 60 ± 2% for mock and AP180-C, respectively (p > 0.5; n = 3). E, [3H]HC-3 binding after ligand preincubation (20 μm choline or 1 μm HC-3) in HEK293 cells cotransfected with wild-type or a dominant-negative mutant (K44A) of dynamin 2, as well as CHT1. F, Cell-surface biotinylation assay in HEK293 cells cotransfected with mock or the dynamin 2 mutant. Results of cell-surface biotinylation assay after ligand preincubation are shown in the bottom.
Figure 5.
Figure 5.
pH dependence of the CHT1 cell-surface expression level in HEK293 cells. A, Extracellular pH-dependent [3H]HC-3 binding in 293–hCHT1 cells. Data were normalized to the value at pH 7.5. B, Extracellular pH-dependent [3H]choline uptake. C, [3H]HC-3 binding after preincubation with buffers of various pH for 30 min. D, [3H]choline uptake after preincubation with buffers of various pH for 30 min. E, CHT1 cell-surface expression level in cells that were preincubated for 30 min with a buffer of indicated pH. Note that N-cadherin expression is independent of extracellular pH in the same cells (bottom). F, Internalization of the cell-surface biotinylated CHT1 measured in an extracellular buffer with a different pH. PM, Plasma membrane fraction. Densitometric analyses of the time courses of CHT1 internalization at pH 5.5, 7.5, or 9.5 are shown in the bottom. The data are normalized to levels observed in the PM fraction.
Figure 6.
Figure 6.
Characterization of the ligand-regulated surface expression level of CHT1 in rat brain synaptosomes. A, Saturation analysis of [3H]choline uptake after 15 min choline preincubation (10 μm). B, Time course of ligand preincubation on [3H]choline (Ch) uptake. Synaptosomes were preincubated for the indicated times with 10 μm choline or 10 U/ml choline oxidase, and [3H]choline uptake was measured. *p < 0.05 relative to control at each time point, Student's t test with Bonferroni's correction. C, Time course of choline incubation on [3H]choline uptake after depolarization. After K+ depolarization for 15 min, synaptosomes were further incubated with normal buffer at 37°C for the indicated times with 10 μm choline or 1 μm HC-3 and subjected to [3H]choline uptake assays. Time course curves were fitted to the following function: (V0V) + V × exp(−0.693t/t1/2), where V0 represents [3H]choline uptake rate without postincubation. D, [3H]HC-3 binding at 5 min after K+ depolarization in synaptosomes incubated with 10 μm choline or 1 μm HC-3. [3H]HC-3 binding relative to that of synaptosomes without K+-depolarization treatment was 168 ± 5 and 134 ± 4% for control and choline, respectively; p < 0.05, Student's t test with Bonferroni's correction (n = 3).

Similar articles

Cited by

References

    1. Bernstein EM, Quick MW. Regulation of gamma-aminobutyric acid (GABA) transporters by extracellular GABA. J Biol Chem. 1999;274:889–895. - PubMed
    1. Brandon EP, Mellott T, Pizzo DP, Coufal N, D'Amour KA, Gobeske K, Lortie M, López-Coviella I, Berse B, Thal LJ, Gage FH, Blusztajn JK. Choline transporter 1 maintains cholinergic function in choline acetyltransferase haploinsufficiency. J Neurosci. 2004;24:5459–5466. - PMC - PubMed
    1. Brock M, Nickel AC, Madziar B, Blusztajn JK, Berse B. Differential regulation of the high affinity choline transporter and the cholinergic locus by cAMP signaling pathways. Brain Res. 2007;1145:1–10. - PMC - PubMed
    1. Chi L, Reith ME. Substrate-induced trafficking of the dopamine transporter in heterologously expressing cells and in rat striatal synaptosomal preparations. J Pharmacol Exp Ther. 2003;307:729–736. - PubMed
    1. Doherty GJ, McMahon HT. Mechanisms of endocytosis. Annu Rev Biochem. 2009;78:857–902. - PubMed

Publication types

MeSH terms

LinkOut - more resources