. 2011 Oct 19;31(42):15016-25.
doi: 10.1523/JNEUROSCI.0890-11.2011.

Multiple adaptable mechanisms early in the primate visual pathway

Affiliations

Multiple adaptable mechanisms early in the primate visual pathway

Neel T Dhruv et al. J Neurosci. .

Abstract

We describe experiments that isolate and characterize multiple adaptable mechanisms that influence responses of orientation-selective neurons in primary visual cortex (V1) of anesthetized macaque (Macaca fascicularis). The results suggest that three adaptable stages of machinery shape neural responses in V1: a broadly tuned early stage and a spatio-temporally tuned later stage, both of which provide excitatory input, and a normalization pool that is also broadly tuned. The early stage and the normalization pool are revealed by adapting gratings that themselves fail to evoke a response from the neuron: either low temporal frequency gratings at the null orientation or gratings of any orientation drifting at high temporal frequencies. When effective, adapting stimuli that altered the sensitivity of these two mechanisms caused reductions of contrast gain and often brought about a paradoxical increase in response gain due to a relatively greater desensitization of the normalization pool. The tuned mechanism is desensitized only by stimuli well matched to a neuron's receptive field. We could thus infer desensitization of the tuned mechanism by comparing effects obtained with adapting gratings of preferred and null orientation modulated at low temporal frequencies.


Figures

Figure 1.
Figure 1.
Model of adaptable mechanisms in V1. Desensitization can occur in any of three mechanisms: (1) an early stage (ES) that is untuned for orientation and is sensitive to a broad range of temporal frequencies; (2) a tuned mechanism that is sensitive to low temporal frequencies; (3) a normalization pool (NP) that is untuned for orientation and sensitive to a broad temporal frequency range overlapping with the range of the early stage. The early stage encompasses subcortical and input-layer cortical neurons, some of which (e.g., M-pathway neurons and neurons in the cortical input layers) are susceptible to adaptation AES. The normalization stage pools across the output of early-stage and second-stage mechanisms, with desensitization occurring after pooling ANP. The output of the model neuron can also be influenced by adaptation, presumably through hyperpolarization Vt.
Figure 2.
Figure 2.
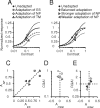
Computation of gain changes following adaptation. CGAI is computed as the ratio of the contrasts that produce half the maximum response. RGAI is computed as the ratio of the best fitting linear slopes through the rising portion of the contrast response when plotted on logarithmic abscissae. MRAI is computed as the ratio of the responses to full contrast stimuli. Data from cell of Figure 3B, top row, for low temporal frequency preferred adapter. Smooth lines are best-fitting hyperbolic ratio functions.
Figure 3.
Figure 3.
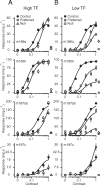
Changes in response brought about by adaptation to different stimuli. A, Contrast response functions of four cells when the cell was unadapted (filled symbols) or adapted to a high temporal frequency grating at full-contrast (open symbols), at the preferred orientation (circles) or null orientation (triangles). B, Contrast response functions of the same four cells when the cell was unadapted (filled symbols; same as in A) or adapted to a low temporal frequency grating at full contrast (open symbols) at the preferred orientation (diamonds) or null orientation (squares). Smooth lines are best fitting solutions to the model. Responses to the different adapters (averages over the first second of adaptation) are plotted to the right of each panel with the appropriate symbol. The response to the adapter could be different from the response to the full contrast stimulus in the low temporal frequency preferred adaptation condition because the adapting stimulus was modulated at a lower temporal frequency (usually 1–2 Hz) than the optimal temporal frequency probes. Vertical bars denote ±1 SEM. Example cell in bottom row was characterized for adaptation only to stimuli at the null orientation.
Figure 4.
Figure 4.
How desensitization of different mechanisms affects a cell's response. A, Contrast response functions before and after adaptation occurring separately in each adaptable mechanism. The solid line shows the control condition contrast response. The long dashed line shows the effect of desensitizing only the early stage. The short dashed line shows the effect of desensitizing only the normalization pool. The dotted line shows the effect of desensitizing only the spatio-temporally tuned mechanism. B, Contrast response functions before and after the early stage and the normalization pool are desensitized concurrently. The solid line is the control condition contrast response curve (same as in A). The long dashed line shows the effect of desensitizing the two mechanisms equally. The short dashed line shows the effect of desensitizing the normalization pool more than the early stage. The dotted line shows the effect of desensitizing the early stage more than the normalization pool. Symbols in A and B are plotted at the semisaturation point of the corresponding contrast response function. C, Values of the adaptation parameters (AES and ANP) that produced the contrast response functions in A and B. D, E, Effect of changing the exponent (α) on the expression of adaptation through CGAI (D) and RGAI (E). Black symbols represent gain change for the exponent value used in A and B; gray symbols represent gain change for an exponent twice as large (curves not shown in A and B). Symbols in D and E correspond to the adaptation parameters shown in C.
Figure 5.
Figure 5.
A, B, Extent to which the early stage (AES) and the normalization pool (ANP) are desensitized by high temporal frequency adapters (A) and by low temporal frequency adapters (B). Points along the diagonal represent cells in which the two mechanisms are desensitized equally. Points below the diagonal denote cells with stronger desensitization of the normalization pool, resulting in an increased response to high contrast stimuli. C, How desensitization of the tuned mechanism varies with the ratio of the desensitization in the early stage and normalization pool. Points with values greater than zero indicate a decrease in response.
Figure 6.
Figure 6.
Effects of different adapting conditions on contrast gain (CGAI) and response gain (RGAI). A, Low temporal frequency adapter at the preferred orientation; B, low temporal frequency adapter at the null orientation; D, high temporal frequency adapter at the preferred orientation; and E, high temporal frequency adapter at the null orientation. Vertical and horizontal dotted lines denote no change in CGAI and RGAI, respectively. Triangles on the axes show means. Gray boxes at the center of each plot indicate average 95% confidence intervals derived from a bootstrap procedure. Points outside the rectangles identify cells that are significantly affected by adaptation. The number of cells in each quadrant is indicated by the number in the corner. C, F, CGAI for the two low temporal frequency (C) and high temporal frequency (F) adapters.
Figure 7.
Figure 7.
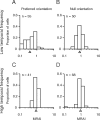
Effect of adaptation on maximum response. Panels show distribution of MRAI following adaptation under four different conditions: low temporal frequency gratings at the preferred orientation (A), low temporal frequency gratings at the null orientation (B), high temporal frequency gratings at the preferred orientation (C), and high temporal frequency gratings at the null orientation (D). Triangles on the axes show means.
Figure 8.
Figure 8.
Comparison of gain changes estimated from the model and those derived from data. CGAI (top row) and RGAI (bottom row) values estimated from the model are plotted against those derived from the data for low temporal frequency gratings at the null orientation (A), high temporal frequency gratings at the preferred orientation (B), and high temporal frequency gratings at the null orientation (C). Correlation coefficients (all significant p < 0.05) are shown in top left corner of each panel.

Similar articles

Cited by

References

    1. Albrecht DG, Hamilton DB. Striate cortex of monkey and cat: contrast response function. J Neurophysiol. 1982;48:217–237. - PubMed
    1. Albrecht DG, Farrar SB, Hamilton DB. Spatial contrast adaptation characteristics of neurones recorded in the cat's visual cortex. J Physiol. 1984;347:713–739. - PMC - PubMed
    1. Alitto HJ, Usrey WM. Origin and dynamics of extraclassical suppression in the lateral geniculate nucleus of the macaque monkey. Neuron. 2008;57:135–146. - PMC - PubMed
    1. Allison JD, Melzer P, Ding Y, Bonds AB, Casagrande VA. Differential contributions of magnocellular and parvocellular pathways to the contrast response of neurons in bush baby primary visual cortex (V1) Vis Neurosci. 2000;17:71–76. - PubMed
    1. Blakemore C, Campbell FW. On the existence of neurones in the human visual system selectively sensitive to the orientation and size of retinal images. J Physiol. 1969;203:237–260. - PMC - PubMed

Publication types

LinkOut - more resources