. 2011 Oct 19;31(42):15053-64.
doi: 10.1523/JNEUROSCI.0101-11.2011.

Where fMRI and electrophysiology agree to disagree: corticothalamic and striatal activity patterns in the WAG/Rij rat

Affiliations

Where fMRI and electrophysiology agree to disagree: corticothalamic and striatal activity patterns in the WAG/Rij rat

Asht Mangal Mishra et al. J Neurosci. .

Abstract

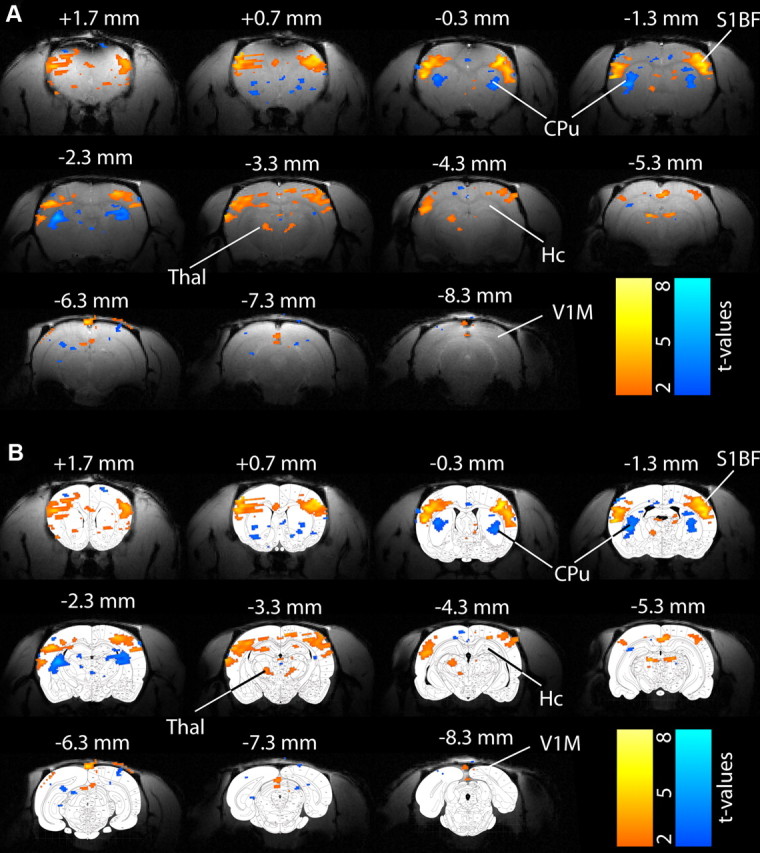
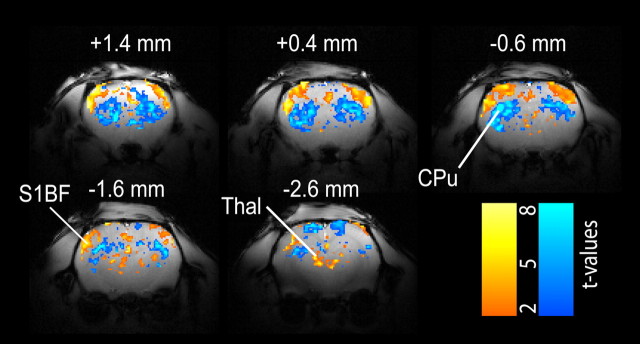
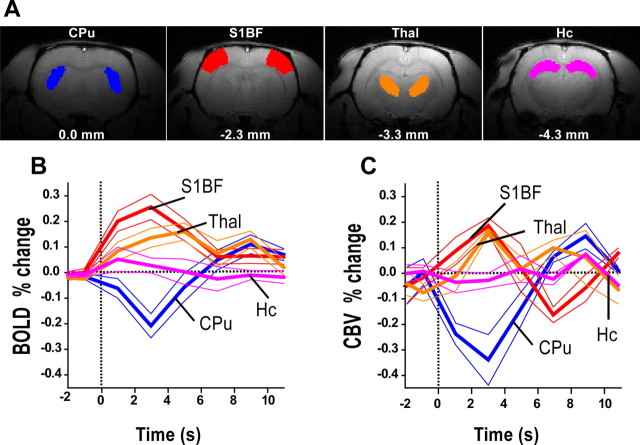
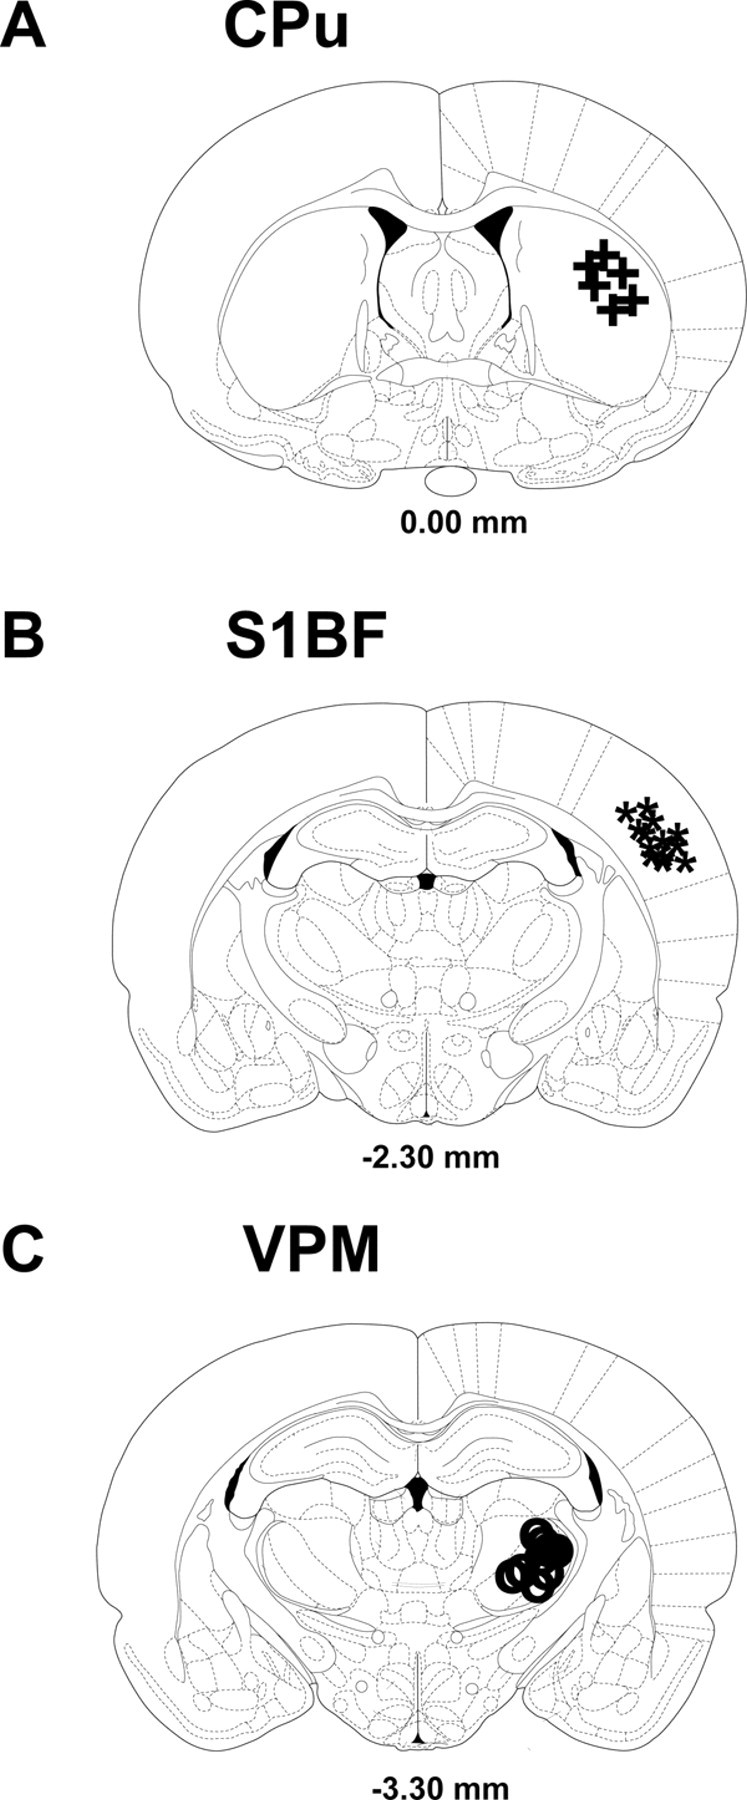
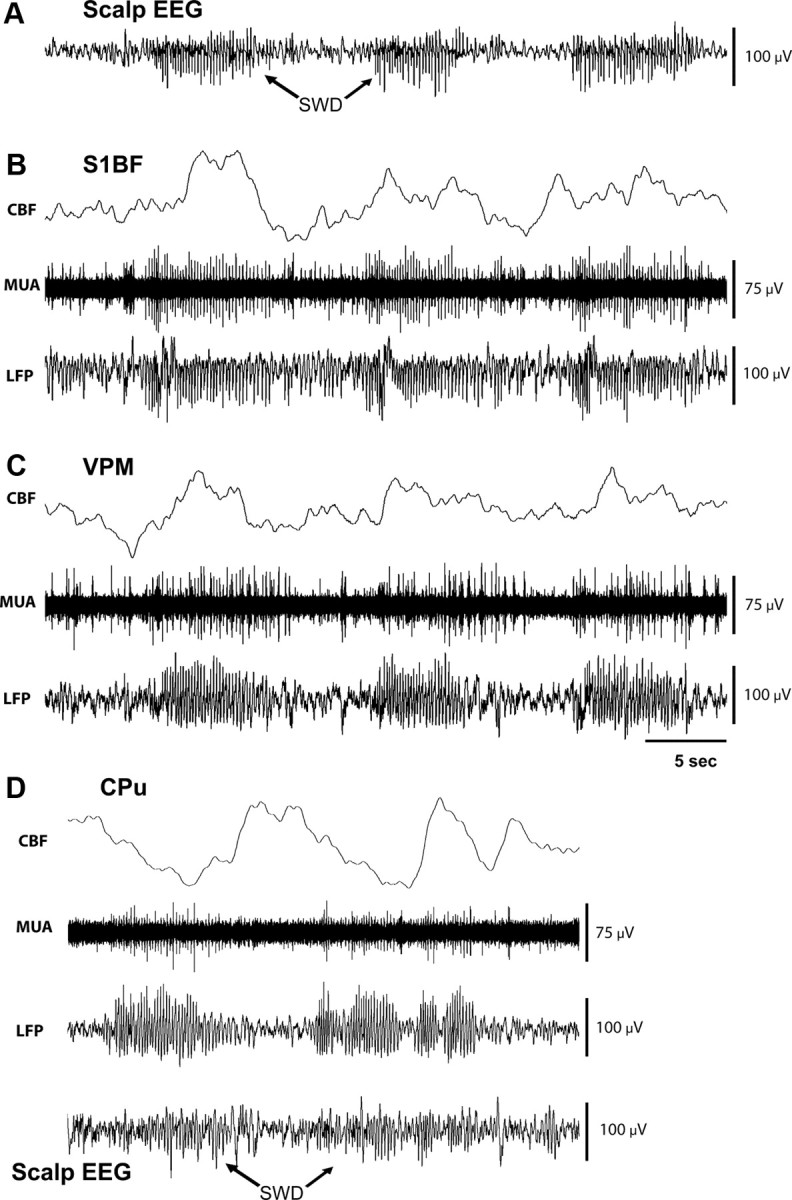
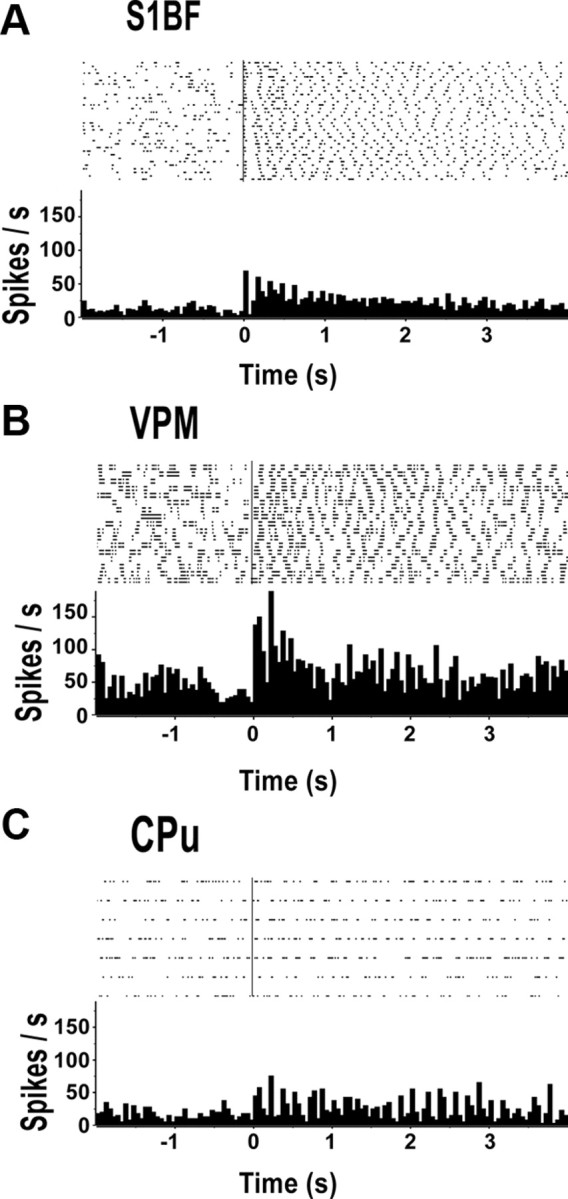
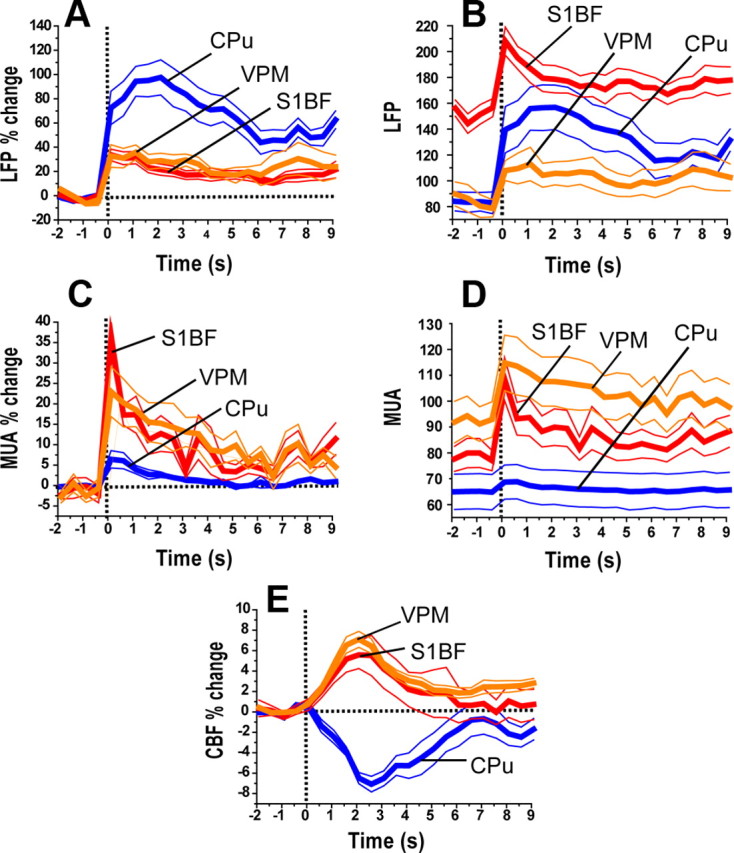
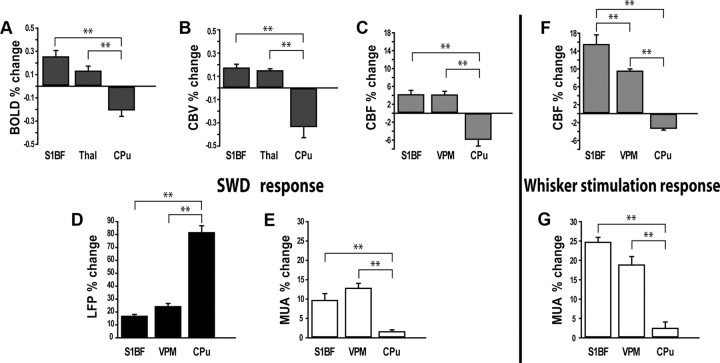
The relationship between neuronal activity and hemodynamic changes plays a central role in functional neuroimaging. Under normal conditions and in neurological disorders such as epilepsy, it is commonly assumed that increased functional magnetic resonance imaging (fMRI) signals reflect increased neuronal activity and that fMRI decreases represent neuronal activity decreases. Recent work suggests that these assumptions usually hold true in the cerebral cortex. However, less is known about the basis of fMRI signals from subcortical structures such as the thalamus and basal ganglia. We used WAG/Rij rats (Wistar albino Glaxo rats of Rijswijk), an established animal model of human absence epilepsy, to perform fMRI studies with blood oxygen level-dependent and cerebral blood volume (CBV) contrasts at 9.4 tesla, as well as laser Doppler cerebral blood flow (CBF), local field potential (LFP), and multiunit activity (MUA) recordings. We found that, during spike-wave discharges, the somatosensory cortex and thalamus showed increased fMRI, CBV, CBF, LFP, and MUA signals. However, the caudate-putamen showed fMRI, CBV, and CBF decreases despite increases in LFP and MUA signals. Similarly, during normal whisker stimulation, the cortex and thalamus showed increases in CBF and MUA, whereas the caudate-putamen showed decreased CBF with increased MUA. These findings suggest that neuroimaging-related signals and electrophysiology tend to agree in the cortex and thalamus but disagree in the caudate-putamen. These opposite changes in vascular and electrical activity indicate that caution should be applied when interpreting fMRI signals in both health and disease from the caudate-putamen, as well as possibly from other subcortical structures.


Figures

Figure 1.
Figure 1.
Example of BOLD fMRI changes 2–4 s after SWD onset in a WAG/Rij rat at 9.4 T and overlay of t maps on rat brain atlas. A, S1BF and thalamus (Thal) show prominent increases in BOLD signal during SWDs. Prominent BOLD decreases are present in the CPu. No changes are seen in V1M or hippocampus (Hc). Smaller changes are seen in other areas. Simultaneous EEG acquired during fMRI was used to identify images obtained 2–4 s after SWD onset for comparison with baseline images obtained immediately before start of SWDs. Results are displayed as t maps of BOLD fMRI signal superimposed on high-resolution anatomical images. t values were generated using a paired t test in which pairs consisted of one seizure acquisition taken 2–4 s after seizure onset and the baseline images acquired just preceding SWD onset (n = 26 SWD episodes). Slices are shown from anterior to posterior, with approximate coordinates relative to bregma (Paxinos and Watson, 1998). Color bars indicate t values for increases (warm colors) and decreases (cold colors). Threshold value t > 2. B, Overlay of t maps on rat brain atlas (Paxinos and Watson, 1998, reproduced with permission) shows anatomical locations of BOLD fMRI signal increases and decreases.
Figure 2.
Figure 2.
Example of CBV changes during SWDs in a WAG/Rij rat at 9.4 T. S1BF and thalamus (Thal) show prominent increases in CBV signal during SWD, whereas CPu shows decreases, with similar regions and direction of changes compared with BOLD fMRI (Fig. 1). Simultaneous EEG acquired during fMRI was used to identify images obtained 2–4 s after SWD onset. t maps of CBV changes during SWD were calculated as described in Materials and Methods and superimposed on anatomical images. Slices are shown from anterior to posterior, with approximate coordinates relative to bregma (Paxinos and Watson, 1998). Color bars indicate t values for increases (warm colors) and decreases (cold colors). n = 6 SWDs during CBV and 10 SWDs during BOLD in the same animal used for CBV calculations (see Materials and Methods). Threshold value t > 2.
Figure 3.
Figure 3.
BOLD fMRI and CBV increase in S1BF and thalamus (Thal) but decrease in CPu during SWDs. Time course of signals are displayed as percentage change relative to pre-seizure baseline data (see Materials and Methods for definition of baseline). A, ROI examples displayed on structural images for a single animal, based on anatomical regions (Paxinos and Watson, 1998). Similar ROIs were created for all animals. B, BOLD signals changes (n = 22 animals; data are from 1856 SWDs total). C, CBV signal changes (n = 5 animals; data are from 418 SWD total). Time courses are displayed as mean ± SEM, with 2 s time bins. Vertical line at time = 0 marks SWD onset. Hc, Hippocampus.
Figure 4.
Figure 4.
Summary of verification of recording sites on histology. Schematic mapping of recorded sites on coronal brain sections (modified with permission from Paxinos and Watson, 1998) to show location of the tip of combined recording electrode/laser Doppler probe assembly as seen on histological sections from CPu (A), S1BF (B), and VPM (C).
Figure 5.
Figure 5.
SWDs produce increased electrical activity with increased CBF in cortex and thalamus but decreased CBF in striatum. A–C, Example of simultaneous recordings of MUA, LFPs, and laser Doppler CBF from S1BF and VPM, as well as scalp EEG during three consecutive SWD episodes. A, Scalp EEG demonstrating three SWD episodes. B, Recordings from S1BF during SWDs show increases in multiunit activity and local field potentials, followed by an increase in CBF. C, Recordings from VPM during SWD show increases in local field potentials and multiunit activity, followed by an increase in CBF. D, Example from a different animal of simultaneous recordings of scalp EEG, MUA, LFP, and CBF from CPu during SWD episodes (simultaneous S1BF recordings for this animal are not shown). Recordings from CPu during SWD show increases in LFP, subtle increases in MUA, and large decreases in CBF. Recordings of CBF (in B–D) are displayed with 0.5 s time bins.
Figure 6.
Figure 6.
PSTHs of unit activity. Examples of PSTHs around spike-wave seizures recorded from CPu (n = 7 SWDs), S1BF (n = 34 SWDs), and VPM (n = 17 SWDs). Vertical lines in the raster plots (top) indicate seizure onset. PSTH bins (bottom) are 50 ms.
Figure 7.
Figure 7.
Mean time courses of electrophysiology and CBF measurements during SWDs. Signals are shown in S1BF, VPM, and CPu. Time courses represent percentage change in LFP signal amplitude (Vrms) compared with 2 s baseline (A), LFP signal amplitude (Vrms) without percentage change calculation (B), percentage change in MUA signal amplitude (Vrms) compared with 2 s baseline (C), MUA signal amplitude (Vrms) without percentage change calculation (D), and percentage change in CBF signal (E). Recording sites (Fig. 4) were matched to ROIs chosen in analyzing fMRI signal time courses (Fig. 3). During seizures, LFPs (A, B) and MUA (C, D) showed a marked increase in signal amplitude in S1BF and VPM, accompanied by strong increases in CBF (E). In contrast, CPu recordings showed intense signal increases for LFP (A, B) associated with a small increase in MUA (C, D) and a large decrease in CBF (E) during SWDs. Note that y-axes in A–E are not drawn to the same scale. Time courses are displayed as mean ± SEM, with 0.5 s time bins. Data are from S1BF (n = 13 animals), VPM (n = 9 animals), and CPu (n = 6 animals). Vertical line at time = 0 marks SWD onset.
Figure 8.
Figure 8.
Summary of neuroimaging-related (top row) and electrophysiology (bottom row) signal changes during SWDs and whisker stimulation. Values are mean percentage change, comparing the baseline signal with 2–4 s after onset of SWDs or whisker stimulation. A, BOLD during SWD; B, CBV during SWD; C, CBF during SWD; D, LFP signal amplitude (Vrms) during SWD; E, MUA signal amplitude (Vrms) during SWD. A–C and D,E are from same data shown in Figures 3 and 7, respectively. F, CBF during whisker stimulation. G, MUA signal amplitude (Vrms) during whisker stimulation. Overall across conditions, S1BF and VPM showed increases in all measurements (BOLD, CBV, CBF, LFP, and MUA). CPu showed large increases in LFP, a small increase in MUA, but a large decrease in BOLD, CBV, and CBF. **p < 0.01, ANOVA with post hoc Bonferroni's correction for multiple comparisons. Note that y-axes are drawn to the same scale for similar measurements for A and B (BOLD, CBV), for C and F (CBF), and for E and G (MUA). Thal, Thalamus.

Similar articles

Cited by

References

    1. Aghakhani Y, Bagshaw AP, Bénar CG, Hawco C, Andermann F, Dubeau F, Gotman J. fMRI activation during spike and wave discharges in idiopathic generalized epilepsy. Brain. 2004;127:1127–1144. - PubMed
    1. Ances BM. Coupling of changes in cerebral blood flow with neural activity: what must initially dip must come back up. J Cereb Blood Flow Metab. 2004;24:1–6. - PubMed
    1. Archer JS, Abbott DF, Waites AB, Jackson GD. fMRI “deactivation” of the posterior cingulate during generalized spike and wave. Neuroimage. 2003;20:1915–1922. - PubMed
    1. Bai X, Vestal M, Berman R, Negishi M, Spann M, Vega C, Desalvo M, Novotny EJ, Constable RT, Blumenfeld H. Dynamic time course of typical childhood absence seizures: EEG, behavior, and functional magnetic resonance imaging. J Neurosci. 2010;30:5884–5893. - PMC - PubMed
    1. Benner T, van der Kouwe AJ, Kirsch JE, Sorensen AG. Real-time RF pulse adjustment for B0 drift correction. Magn Reson Med. 2006;56:204–209. - PubMed

Publication types

MeSH terms