. 2011 Oct 19;31(42):15136-43.
doi: 10.1523/JNEUROSCI.1367-11.2011.

Motor adaptation training for faster relearning

Affiliations

Motor adaptation training for faster relearning

Laura A Malone et al. J Neurosci. .

Abstract

Adaptation is an error-driven motor learning process that can account for predictable changes in the environment (e.g., walking on ice) or in ourselves (e.g., injury). Our ability to recall and build upon adapted motor patterns across days is essential to this learning process. We investigated how different training paradigms affect the day-to-day memory of an adapted walking pattern. Healthy human adults walked on a split-belt treadmill, and returned the following day to assess recall, relearning rate, and performance. In the first experiment, one group adapted and de-adapted (i.e., washed-out the learning) several times on day 1 to practice the initial stage of learning where errors are large; another group adapted only one time and then practiced in the adapted ("learned") state where errors were small. On day 2, they performed washout trials before readapting. The group that repeatedly practiced the initial portion of adaptation where errors are large showed the fastest relearning on the second day. In fact, the memory was nearly as strong as that of a third group that was left overnight in the adapted state and was not washed-out before reexposure on the second day. This demonstrates that alternating exposures to early adaptation and washout can enhance readaptation. In the second experiment, we tested whether the opposite split-belt pattern interferes with day 2 relearning. Surprisingly, it did not, and instead was similar to practicing in the adapted state. These results show that the structure of the initial phase of learning influences the ease of motor relearning.


Figures

Figure 1.
Figure 1.
A, Diagram of marker location and limb angle convention. B, Experimental paradigm showing the periods of split-belt waking in gray lines and tied walking in black. Dotted gray lines represent split-belt walking of the opposite speed ratio. The Switch Control group sat for 5 min between adaptation blocks. C, Schematic showing how step symmetry can be changed during adaptation. On the left are the limb angle trajectories during early adaptation where step lengths are asymmetric. Two possible ways to make stepping more symmetric are shown on the right. The center of oscillation shift (top) is a spatial change where the limbs gradually shift to oscillate about a midpoint closer to a vertical line intersecting the hip (i.e., center of oscillation = 0). Alternatively the timing of limb motion (i.e., phase shift) can be altered to equalize stepping (shown at bottom). (Figure adapted from Malone and Bastian, 2010.)
Figure 2.
Figure 2.
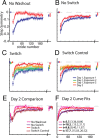
Comparison of step symmetry adaptation across groups. Baseline, first stride, adaptation curves (smoothed by 3 strides) for a portion of training epochs (2–190), and final plateau values are shown. A, No Washout. Mean step symmetry values subtracted from baseline are shown. The first stride is off-set as individual symbols, with mean and SE bars. Average adaptation curves (±SEs in shaded region) for strides 2–190 (∼5 min) of adaptation on day 1 and day 2 are shown in blue and red lines, respectively. Points plotted at the end of these curves represent means (±SE) of the last 30 steps of adaptation on day 1 and 2, also called “plateau” values. B, No Switch. Data are shown as in A, except that this group had a tied-belt period preceding adaptation on day 2 as well (mean of the last 30 s ± SE shown in red at beginning of plot). C, Switch. Data are shown as in B. This group experienced three 5 min exposures to split-belts, interspersed with 5 min washout periods on day 1. Thus, the data plotted in green and yellow represent average values during the second and third exposures to split-belts, respectively. Mean baseline values for exposures 2 and 3 shown at the beginning of this plot represent mean step symmetry in the last 30 s of the washout period preceding that exposure. D, Switch Control. Data are shown as in C. In this group, subjects were given breaks instead of being washed-out between exposures to split-belts, thus baseline data for exposures 2 and 3 are not shown. E, Comparison of day 2 curves. Day 2 adaptation curves and plateau values for each group are shown. Note that all groups reach the same plateau, but differences are seen in the early change of adaptation, with No Washout showing the most improvement, followed by Switch, while No Switch and Switch Control show the least improvement. F, Exponential curve fits for day 2 curves. Average points are shown for the data presented in E. Single exponential time constants (t) with 95% confidence bounds are shown in the legend.
Figure 3.
Figure 3.
Comparison of adaptation of center of oscillation difference across groups. Averaged data for the No Washout (A), No Switch (B), Switch (C), and Switch Control (D) groups are shown as in Figure 2. Baseline, first stride, adaptation curves for a portion of training epochs (2–190), and final plateau values are shown.
Figure 4.
Figure 4.
Comparison of phasing adaptation across groups. Averaged data for the No Washout (A), No Switch (B), Switch (C), and Switch Control (D) groups are shown as in Figure 2. Baseline, first stride, adaptation curves for a portion of training epochs (2–190), and final plateau values are shown.
Figure 5.
Figure 5.
A–I, Difference between day 1 and 2 for first stride (shown in A, D, G), early change (average of strides 2–30 strides—shown in B, E, H) and plateau (average of last 30 strides—shown in C, F, I). Bars represent group means ± SE, and significant differences are denoted by asterisks. Step symmetry data are shown in A–C, center of oscillation in D–F, and phasing in G–I. Note that there are no significant differences in the first stride (A, D, G) or plateau values for any of the measures (C, F, I); however, there are differences in early change (B, E, H). The differences between groups in early change values for center of oscillation (E) are similar to those seen in step symmetry (B), where the No Washout group shows the best relearning and the No Switch and Switch Control group show the worst relearning. In contrast, for phasing (H), the No Washout group still shows the most relearning, but No Switch, Switch, and Switch Control groups show similar amounts of relearning. Note: Higher values in Figure 5 mean larger changes across days. This normally means that subjects are closer to symmetry on day 2, but some subjects could over-adapt past symmetry, which would also result in larger delta values.
Figure 6.
Figure 6.
Comparison of adaptation of step symmetry across groups for Experiment 2. A–C, Averaged data for the Single A (A), Double A (B), and A-B Group (C) are shown as in Figure 2. Baseline, first stride, and adaptation curves for a portion of training epochs (2–190), and final plateau values are shown. D, Difference between day 1 and 2 for first stride, early change (average of strides 2–30) and plateau (average of last 30 strides). Bars represent group means ± SE. No significant differences were found for any measure.

Similar articles

Cited by

References

    1. Blandin Y, Proteau L, Alain C. On the cognitive processes underlying contextual interference and observational learning. J Mot Behav. 1994;26:18–26. - PubMed
    1. Braun DA, Aertsen A, Wolpert DM, Mehring C. Motor task variation induces structural learning. Curr Biol. 2009;19:352–357. - PMC - PubMed
    1. Braun DA, Mehring C, Wolpert DM. Structure learning in action. Behav Brain Res. 2010;206:157–165. - PMC - PubMed
    1. Caithness G, Osu R, Bays P, Chase H, Klassen J, Kawato M, Wolpert DM, Flanagan JR. Failure to consolidate the consolidation theory of learning for sensorimotor adaptation tasks. J Neurosci. 2004;24:8662–8671. - PMC - PubMed
    1. Choi JT, Bastian AJ. Adaptation reveals independent control networks for human walking. Nat Neurosci. 2007;10:1055–1062. - PubMed

Publication types

LinkOut - more resources