. 2011 Oct 19;31(42):15154-62.
doi: 10.1523/JNEUROSCI.1453-11.2011.

Intact bilateral resting-state networks in the absence of the corpus callosum

Affiliations

Intact bilateral resting-state networks in the absence of the corpus callosum

J Michael Tyszka et al. J Neurosci. .

Abstract

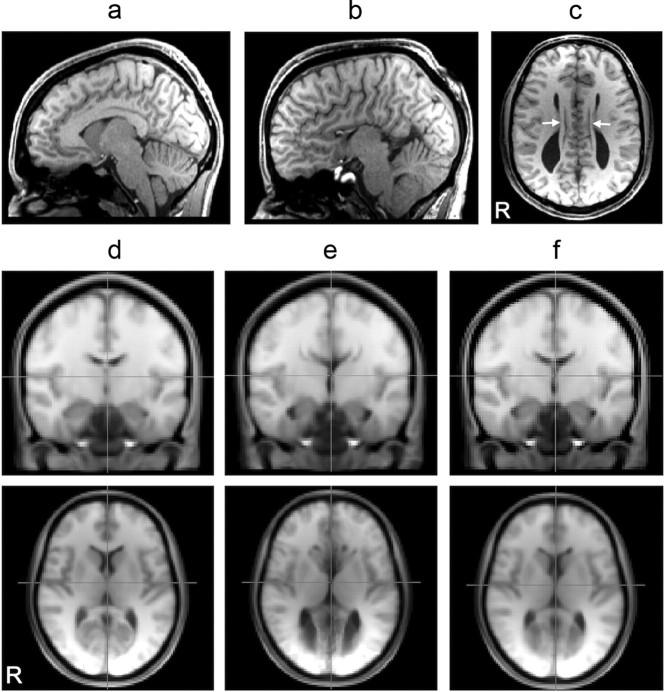
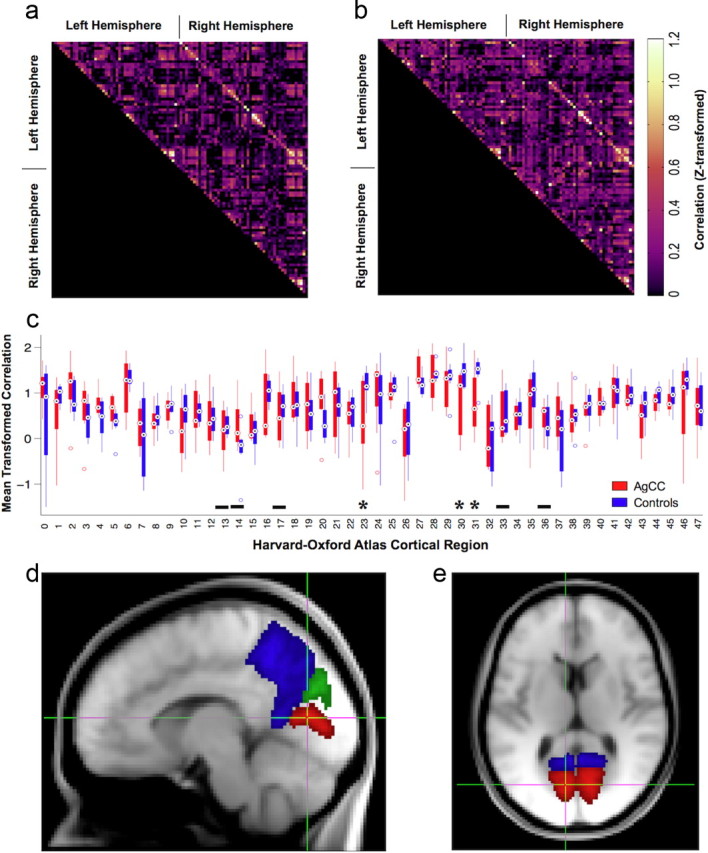
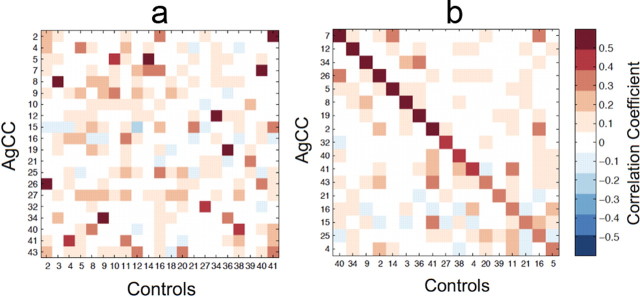
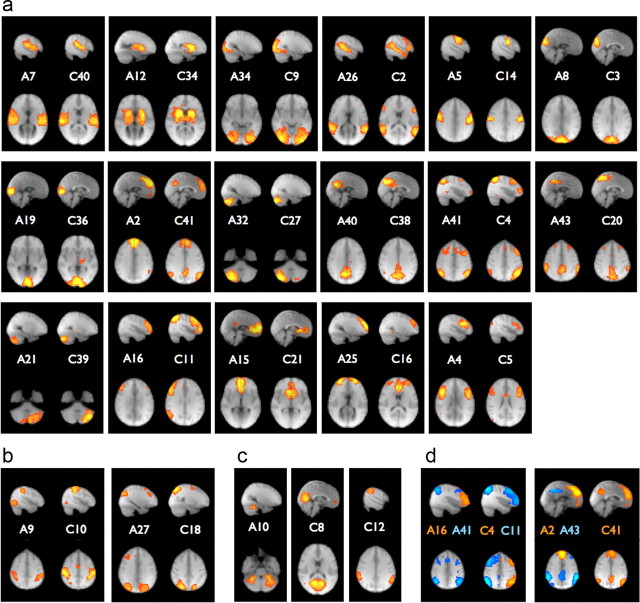
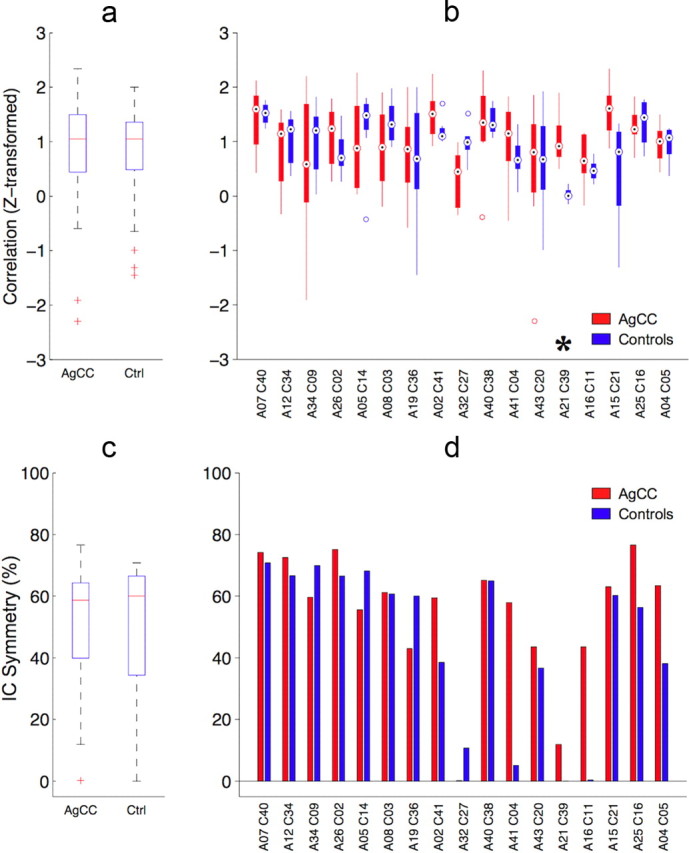
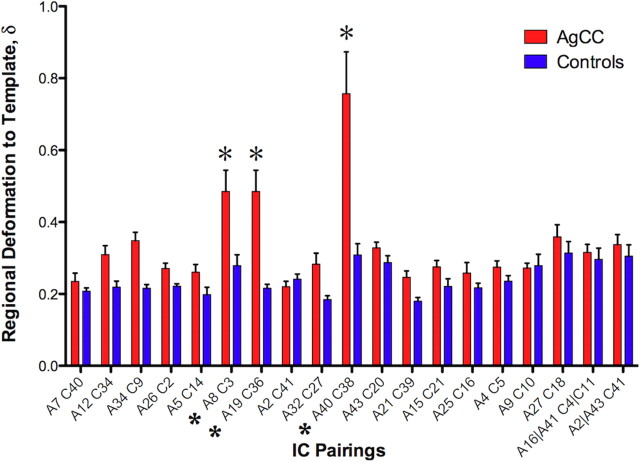
Temporal correlations between different brain regions in the resting-state BOLD signal are thought to reflect intrinsic functional brain connectivity (Biswal et al., 1995; Greicius et al., 2003; Fox et al., 2007). The functional networks identified are typically bilaterally distributed across the cerebral hemispheres, show similarity to known white matter connections (Greicius et al., 2009), and are seen even in anesthetized monkeys (Vincent et al., 2007). Yet it remains unclear how they arise. Here we tested two distinct possibilities: (1) functional networks arise largely from structural connectivity constraints, and generally require direct interactions between functionally coupled regions mediated by white-matter tracts; and (2) functional networks emerge flexibly with the development of normal cognition and behavior and can be realized in multiple structural architectures. We conducted resting-state fMRI in eight adult humans with complete agenesis of the corpus callosum (AgCC) and normal intelligence, and compared their data to those from eight healthy matched controls. We performed three main analyses: anatomical region-of-interest-based correlations to test homotopic functional connectivity, independent component analysis (ICA) to reveal functional networks with a data-driven approach, and ICA-based interhemispheric correlation analysis. Both groups showed equivalently strong homotopic BOLD correlation. Surprisingly, almost all of the group-level independent components identified in controls were observed in AgCC and were predominantly bilaterally symmetric. The results argue that a normal complement of resting-state networks and intact functional coupling between the hemispheres can emerge in the absence of the corpus callosum, favoring the second over the first possibility listed above.


Figures

Figure 1.
Figure 1.
a, b, Representative parasagittal anatomy in control (a) and AgCC (b) subjects (x = −6.0 mm). c, In AgCC, callosal fibers fail to cross midline during development, instead forming Probst bundles (white arrows, z = +20 mm). d–f, A combined midspace template was constructed by iterative nonlinear registration to an initial MNI-space target template of all T1-weighted structural images from both AgCC and control subjects: mean control contribution (d), mean AgCC contribution (e), and combined control and AgCC midspace templates (f).
Figure 2.
Figure 2.
a, b, Mean interregional correlations in BOLD signal from 48 Harvard–Oxford atlas labels in both hemispheres for AgCC subjects (a) and control subjects (b). Homotopic correlations appear on the diagonal of the upper right quadrants of the Fisher z-transformed correlation matrices. c, Pairwise comparison of homotopic correlations (z-transformed) for all 48 regions. Only three regions—intracalcarine (23), precuneus (30), and cuneal (31) cortices—show uncorrected significant differences (*α = 0.05), none of which survive FDR correction (q = 0.05). Regions with partial clipping by the calculation mask in either group are indicated with solid bars (see Results, Atlas-based BOLD correlation). d, e, Location and extent in sagittal (d) and axial (e) sections of the three regions with reduced functional correlation in AgCC identified in c. These regions correspond to areas of significantly increased local deformation in AgCC (Fig. 6).
Figure 3.
Figure 3.
Spatial correlation matching of group-level ICs. a, Full correlation matrix, C, for all neuronal ICs identified in the ICA of control and AgCC groups. Searching rows and columns for the maximum correlation coefficient identifies candidate pairings of ICs from each group. A pairing is defined as invertible if the corresponding matrix element contains the maximum correlation in both row and column. b, Reduced correlation matrix, , composed of the reordered invertible IC pairings.
Figure 4.
Figure 4.
a, Invertible matches between AgCC and control group independent component spatial maps, ordered by decreasing spatial correlation coefficient from highest (A7–C40, r = 0.695) to lowest (A4–C5, r = 0.328). b, Additional pairings (by inspection) from the remaining ICs without invertible matches. c, Unmatched ICs: a bilateral cerebellar component in AgCC (A10) and a medial occipital (C8) and lateral parietal (C12) component in controls. d, Suboptimal invertible matches occur when networks in either group are split into subcomponents by the ICA. For example, the dorsal parietal-frontal networks are lateralized in control subjects (C4 and C11) but split anterior–posterior in AgCC (A16 and A41). Similarly, the default mode network is a single component in the control group (C41), but split into frontal and parietal components in AgCC (A2 and A43).
Figure 5.
Figure 5.
Interhemispheric temporal BOLD correlations for each of the group-level ICs. Masks were defined within the left and right hemispheres for suprathreshold voxels for each group-level IC. Extracted BOLD time series (corrected for white matter and CSF time courses) were correlated and mean Fisher z-transformed correlation calculated for all subjects. a, No significant difference was observed between groups in an unpaired comparison of all neuronal ICs (p = 0.778). b, Interhemispheric correlations for the invertible IC pairs from each group. Only one IC pair showed a significant difference in interhemispheric correlation (*A21–C39, left cerebellum, p = 0.0026 FDR corrected). c, Left–right percentage symmetry of the group IC masks used for calculating the BOLD temporal correlations in a and b did not differ between groups (for symmetry definition, see Materials and Methods). d, Left–right percentage symmetry for the ICs that comprise the 17 invertible IC pairings.
Figure 6.
Figure 6.
Mean absolute deformation within suprathreshold regions for each of the 19 IC pairs illustrated in Figure 4. The combination of A16 and A41 has been paired with C4 and C11, as has A2 and A43 with C41, as described in the Results, Morphological variability and independent component differences. IC pairs with significantly higher regional deformation in AgCC compared with controls (*) all correspond to posterior midline locations, which also show significantly reduced homotopic temporal correlation (Fig. 2c).

References

    1. Anderson JS, Druzgal TJ, Froehlich A, DuBray MB, Lange N, Alexander AL, Abildskov T, Nielsen JA, Cariello AN, Cooperrider JR, Bigler ED, Lainhart JE. Decreased interhemispheric functional connectivity in autism. Cereb Cortex. 2011;21:1134–1146. - PMC - PubMed
    1. Andersson JL, Smith S, Jenkinson M. FNIRT: FMRIB non-linear image registration tool. Paper presented at Meeting for the Organization for Human Brain Mapping; June; Melbourne, Australia. 2008.
    1. Beckmann CF, Smith SM. Probabilistic independent component analysis for functional magnetic resonance imaging. IEEE Trans Med Imaging. 2004;23:137–152. - PubMed
    1. Biswal B, Yetkin FZ, Haughton VM, Hyde JS. Functional connectivity in the motor cortex of resting human brain using echo-planar MRI. Magn Reson Med. 1995;34:537–541. - PubMed
    1. Biswal BB, Mennes M, Zuo XN, Gohel S, Kelly C, Smith SM, Beckmann CF, Adelstein JS, Buckner RL, Colcombe S, Dogonowski AM, Ernst M, Fair D, Hampson M, Hoptman MJ, Hyde JS, Kiviniemi VJ, Kötter R, Li SJ, Lin CP, et al. Toward discovery science of human brain function. Proc Natl Acad Sci U S A. 2010;107:4734–4739. - PMC - PubMed

Publication types

LinkOut - more resources