. 2011 Oct 19;31(42):15163-72.
doi: 10.1523/JNEUROSCI.2617-11.2011.

Activation of Rho GTPases triggers structural remodeling and functional plasticity in the adult rat visual cortex

Affiliations

Activation of Rho GTPases triggers structural remodeling and functional plasticity in the adult rat visual cortex

Chiara Cerri et al. J Neurosci. .

Abstract

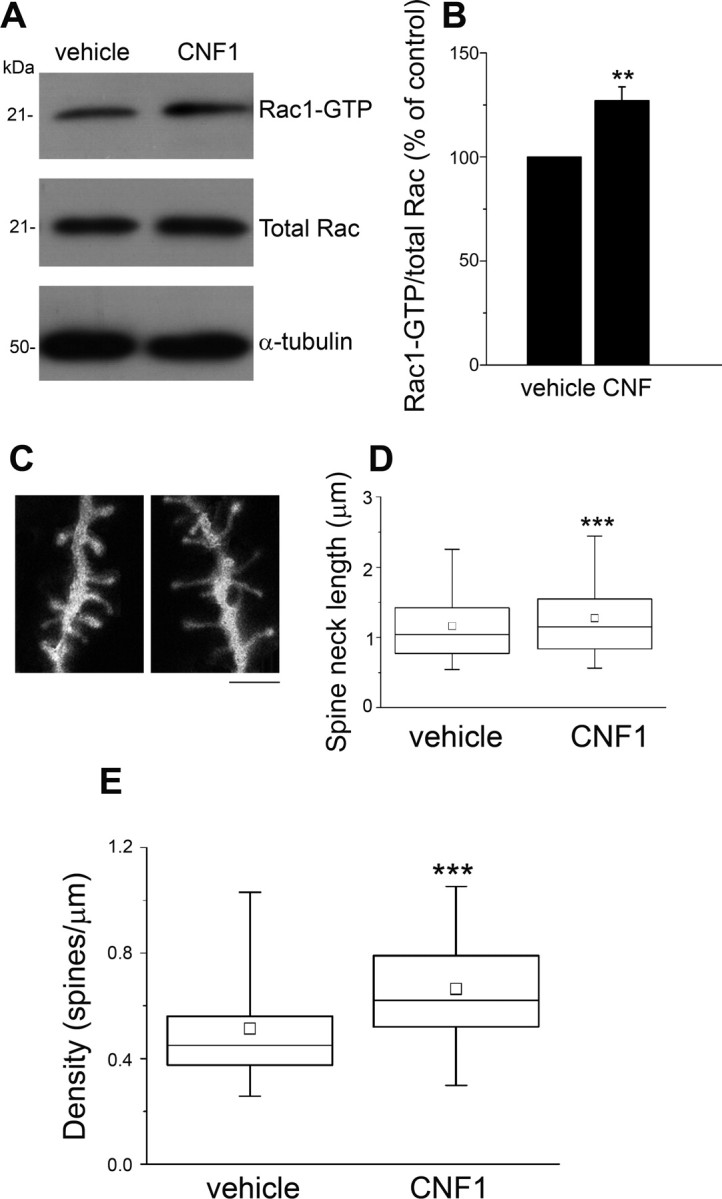
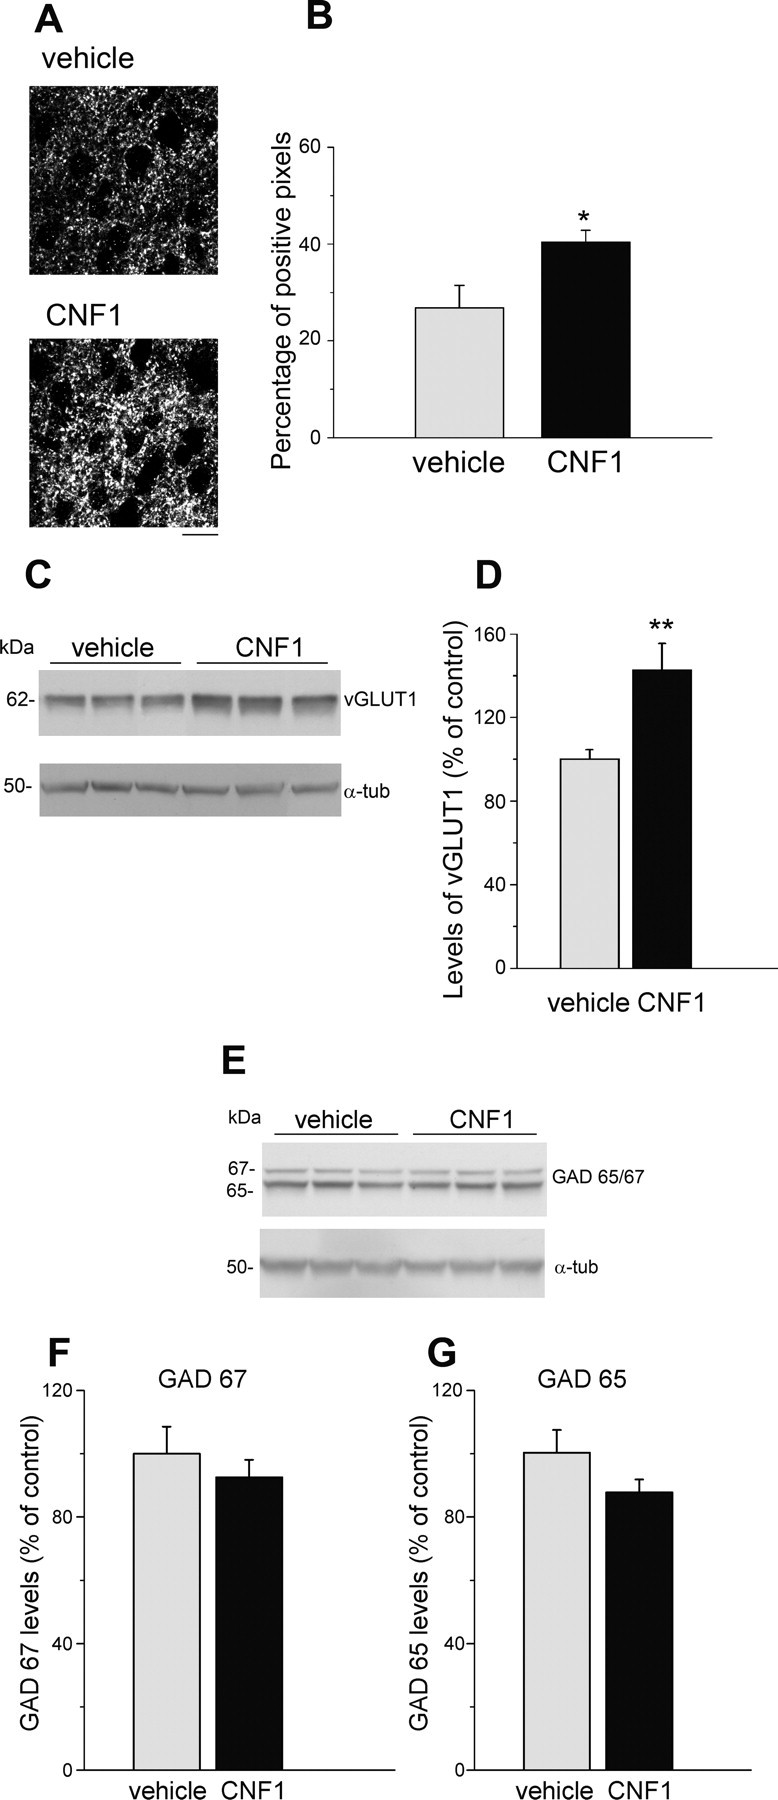
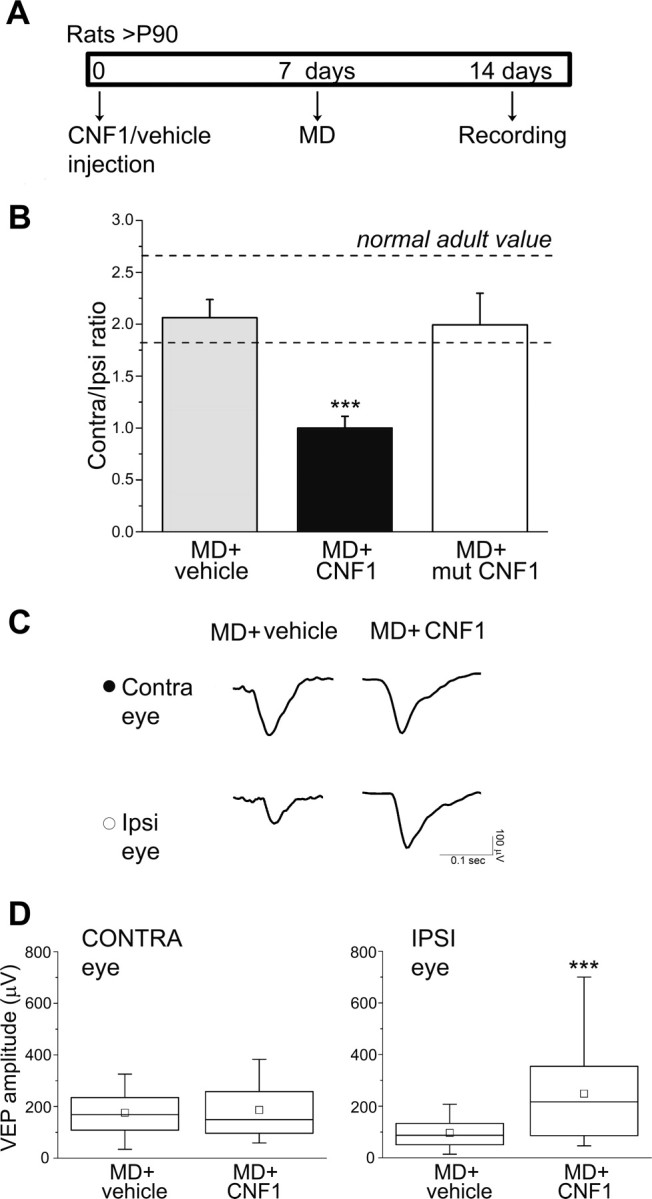
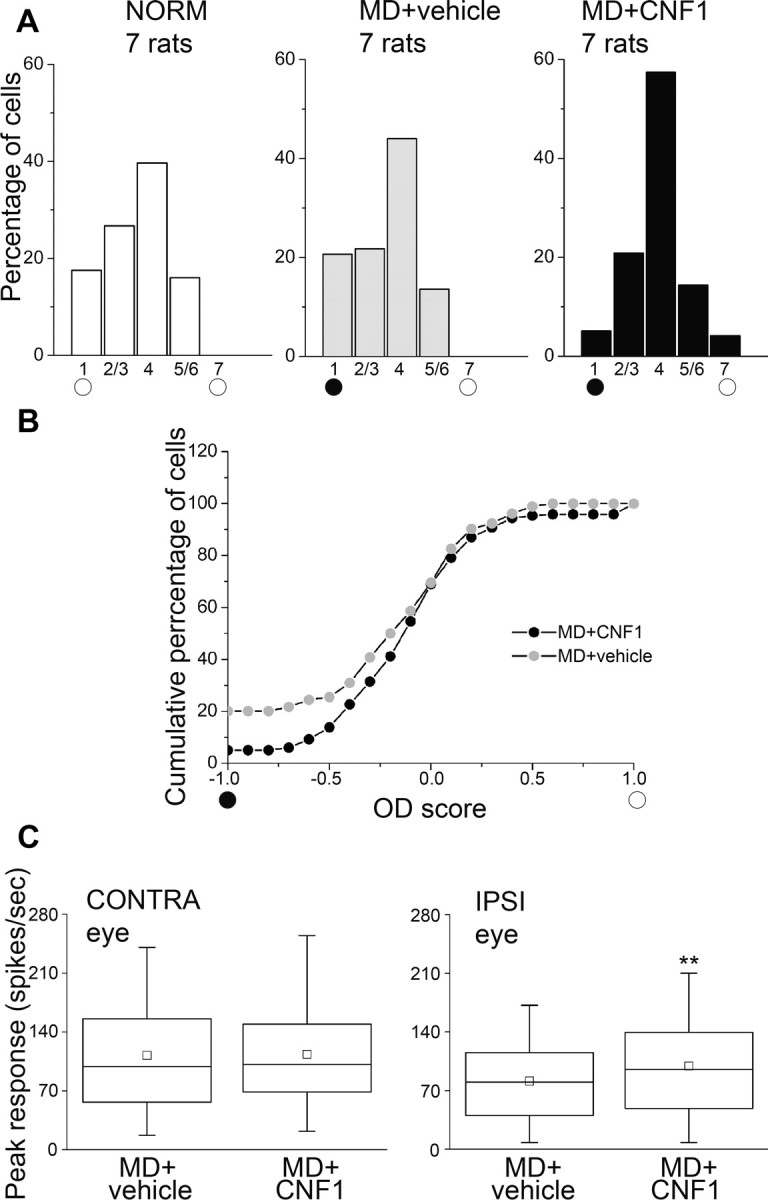
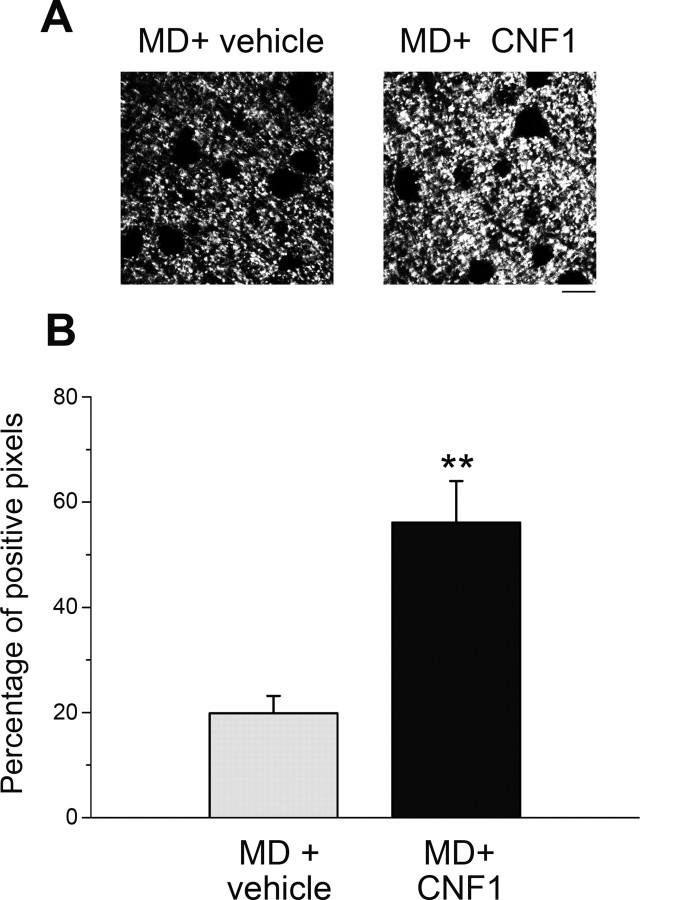
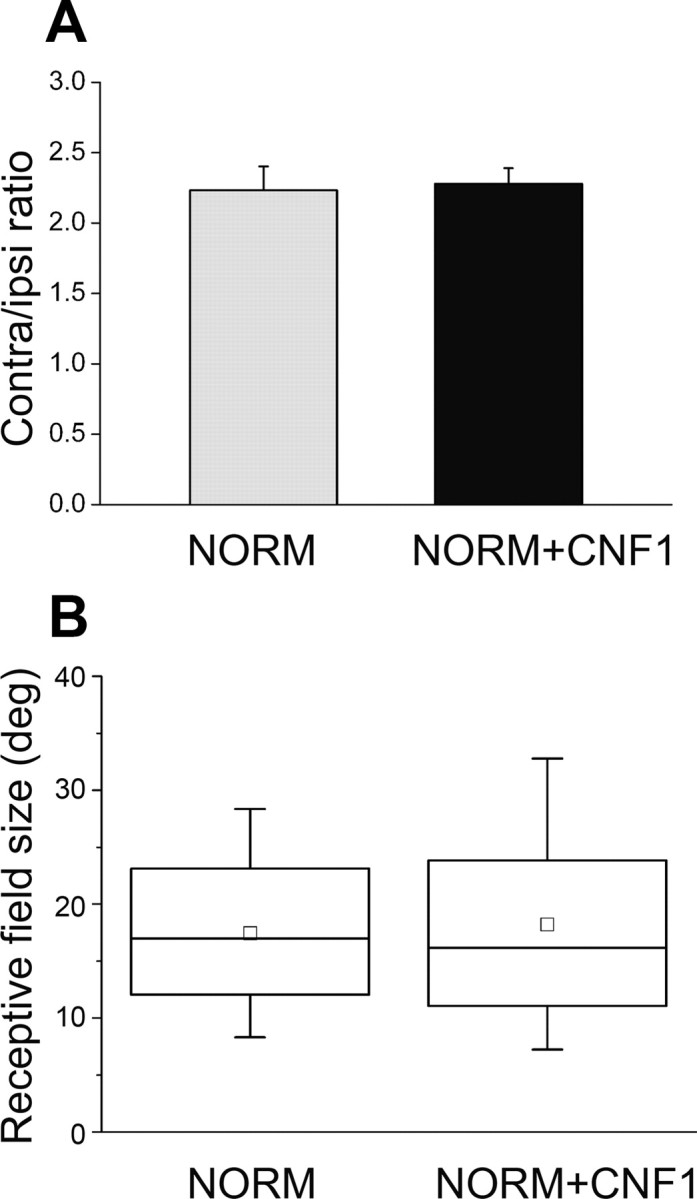
A classical example of age-dependent plasticity is ocular dominance (OD) plasticity, triggered by monocular deprivation (MD). Sensitivity of cortical circuits to a brief period of MD is maximal in juvenile animals and downregulated in adult age. It remains unclear whether a reduced potential for morphological remodeling underlies this downregulation of physiological plasticity in adulthood. Here we have tested whether stimulation of structural rearrangements is effective in promoting experience-dependent plasticity in adult age. We have exploited a bacterial protein toxin, cytotoxic necrotizing factor 1 (CNF1), that regulates actin dynamics and structure of neuronal processes via a persistent activation of Rho GTPases. Injection of CNF1 into the adult rat visual cortex triggered a long-lasting activation of the Rho GTPase Rac1, with a consequent increase in spine density and length in pyramidal neurons. Adult rats treated with CNF1, but not controls, showed an OD shift toward the open eye after MD. CNF1-mediated OD plasticity was selectively attributable to the enhancement of open-eye responses, whereas closed-eye inputs were unaffected. This effect correlated with an increased density of geniculocortical terminals in layer IV of monocularly deprived, CNF1-treated rats. Thus, Rho GTPase activation reinstates OD plasticity in the adult cortex via the potentiation of more active inputs from the open eye. These data establish a direct link between structural remodeling and functional plasticity and demonstrate a role for Rho GTPases in brain plasticity in vivo. The plasticizing effects of Rho GTPase activation may be exploited to promote brain repair.


Figures

Figure 1.
Figure 1.
Enhanced Rac1 activation and increased spine density in the primary visual cortex after CNF1 treatment. A, Representative immunoblot showing the amount of activated Rac1 (Rac1–GTP) in protein extracts from visual cortex 10 d after CNF1 (or vehicle) injection. α-tubulin, Loading control. B, Quantification of the ratio between Rac1–GTP and total Rac in CNF1- and vehicle-treated rats (3 independent experiments). CNF1 significantly enhances Rac1 activation (paired t test, p < 0.01). C, Spine phenotype of visual cortex pyramidal neurons in animals treated with vehicle (left) or CNF1 (right). Scale bar, 1 μm. D, Box chart showing spine neck lengths for vehicle- and CNF1-treated neurons. The horizontal lines denote the 25th, 50th, and 75th percentile values. The error bars denote the 5th and 95th percentile values, whereas the square indicates the mean of the data. Spine neck length is significantly longer in CNF1-treated samples with respect to controls (Mann–Whitney rank-sum test, p < 0.001). E, Analysis of spine density in basal dendrites from layer II–III pyramidal neurons in visual cortex. Neurons of animals treated with CNF1 show a consistent and highly significant increase in the density of protrusions (Mann–Whitney rank-sum test, p < 0.001). The horizontal lines in the box chart denote the 25th, 50th, and 75th percentile values. The error bars denote the 5th and 95th percentile values, whereas the square indicates the mean of the data. We examined 2356 spines from 31 neurons and 1761 spines from 21 neurons in CNF1- and vehicle-treated rats, respectively. **p < 0.01; ***p < 0.001.
Figure 2.
Figure 2.
CNF1 injection increases vGlut-2 and vGlut-1 expression in visual cortex. A, Representative immunostaining for vGlut-2 in layer IV of binocular visual cortex in vehicle- and CNF1-treated rats. Scale bar, 10 μm. B, Quantification reveals a significant increase in density of vGlut-2-positive puncta in the CNF1-infused cortex (t test, p = 0.04). Data are mean ± SEM. C, Representative immunoblotting for vGlut-1 in the visual cortex of vehicle- and CNF1-injected rats. Each lane represents the visual cortex of one animal. α-tubulin, Loading control. D, Quantification of immunoblots for vGlut-1 (8 samples per group examined in triplicate). CNF1 significantly enhances the expression of vGlut-1 (t test, p < 0.01). Data are mean ± SEM. E, Representative immunoblotting for GAD65/67 on protein extracts from the visual cortex of vehicle- and CNF1-injected rats. Each lane represents the visual cortex of one animal. α-tubulin, Loading control. F, G, Quantification of immunoblots for GAD67 (F) and GAD65 (G; 8 samples per group examined in triplicate). There is no significant variation of GAD65/67 levels between vehicle and CNF1 samples (t test, GAD67, p = 0.47; GAD65, p = 0.15). Data are mean ± SEM. *p < 0.05; **p < 0.01.
Figure 3.
Figure 3.
CNF1 has no adverse effects on neuronal survival in the visual cortex. A, Mean cortical thickness in the various experimental groups. NORM, Cortex of normal adult animals (n = 4); vehicle, cortex injected with vehicle solution (n = 4); CNF1, cortex treated with CNF1 (n = 8). There are no significant differences among the groups (one-way ANOVA, p = 0.8). B, Top, Representative immunostaining for the neuronal marker NeuN in layer II–III of the visual cortex of animals in the three experimental groups. CNF1 produces no significant alterations in neuronal density (bottom; one-way ANOVA, p = 0.57). C, Top, Representative immunostaining for the microglial marker OX-42. Density of microglial cells is not impacted by CNF1 administration (bottom; one-way ANOVA, p = 0.63). Scale bars, 100 μm. All data are mean ± SEM. D, Representative high-magnification images of OX-42-positive microglial cells in the various groups. Scale bar, 12 μm.
Figure 4.
Figure 4.
CNF1 injections have no impact on density of perineuronal nets and myelin expression. A, Representative staining for WFA in coronal sections through the visual cortex. NORM, Cortex of normal adult animals (n = 3); vehicle, cortex injected with vehicle solution (n = 4); CNF1, cortex treated with CNF1 (n = 4). Scale bar, 25 μm. B, Density of WFA-positive cells in the visual cortex of the different experimental groups. The statistical analysis reveals no significant differences in perineuronal net density (one-way ANOVA, p = 0.33). C, Representative coronal sections through the visual cortex labeled with antibodies to MBP. Layers I–VI and white matter (WM) are indicated on the left. Scale bar, 100 μm. D, Distribution of MBP intensity within visual cortex. Cortical layers are indicated on the abscissa. There are no significant differences in the intensity profile among the various groups (two-way repeated-measures ANOVA, p = 0.85). WM, White matter.
Figure 5.
Figure 5.
Activation of Rho GTPases reinstates OD plasticity in the adult cortex via potentiation of inputs from the ipsilateral, open eye. A, Experimental protocol. B, C/I VEP ratios in MD animals treated with vehicle (MD + vehicle; n = 11), with CNF1 (MD + CNF1; n = 8) and with a mutated form of CNF1 (MD + mut CNF1; n = 5). In MD + vehicle rats, the C/I ratio is unchanged (post-ANOVA Holm–Sidak test, p = 0.52) compared with the normal adult range (indicated by the dashed lines), whereas in MD + CNF1 animals, there is a dramatic decrease of the C/I ratio (p < 0.001). Injection of a mutated form of CNF1 (mut CNF1) is completely ineffective in shifting OD (MD + mut CNF1 vs MD + vehicle, p = 0.8; MD + mut CNF1 vs MD + CNF1, p = 0.002). Data are mean ± SEM. Normal adult range: mean ± SD value. C, Representative examples of VEP responses for both eyes in MD + vehicle (left column) and MD + CNF1 (right column) rats. Visual stimulus: square-wave grating alternating at 1 Hz, spatial frequency of 0.07 cycles/°, contrast at 90%. CONTRA, Contralateral deprived eye; IPSI, ipsilateral open eye. D, Quantitative analysis of absolute VEP amplitudes in MD + vehicle (n = 11) and MD + CNF1 (n = 8) rats. There is no difference in contralateral eye VEP amplitude between the two groups (Mann–Whitney rank-sum test, p = 0.75, left), whereas ipsilateral eye VEPs are significantly enhanced in CNF1-injected rats (Mann–Whitney rank-sum test, p < 0.001, right). ***p < 0.001.
Figure 6.
Figure 6.
CNF1 injection in adult MD rats shifts the OD histogram toward the open eye. A, OD distributions of naive adult rats (NORM) and rats monocularly deprived for 7 d and treated with either vehicle (MD + vehicle) or CNF1 (MD + CNF1). Recordings were performed in the visual cortex contralateral to the closed eye (filled circle). CNF1 triggers a significant OD shift (χ2 test, p < 0.001) and a reduction of the proportion of neurons driven exclusively by the closed eye (class 1 cells). Number of animals as indicated. NORM, n = 131 cells; MD + vehicle, n = 184 cells; MD + CNF1, n = 216 cells. B, Cumulative distribution of the OD score of MD + vehicle (gray circles) and MD + CNF1 (black circles) rats. The two groups are significantly different from each other (Kolmogorov–Smirnov test, p = 0.01). C, Box chart showing peak firing rates of visual cortical neurons in MD + vehicle and MD + CNF1 rats. Ipsilateral (IPSI), open-eye responses are significantly increased by CNF1 treatment (Mann–Whitney rank-sum test, p = 0.01), whereas contralateral (CONTRA), deprived-eye responses are unaffected (Mann–Whitney rank-sum test, p = 0.64). **p = 0.01.
Figure 7.
Figure 7.
Increased vGlut-2 expression in layer IV of CNF1-treated MD rats. A, Representative immunostaining for vGlut-2 in layer IV of binocular visual cortex contralateral to the deprived eye in vehicle- and CNF1-infused rats. Scale bar, 10 μm. B, Quantification reveals a significant increase in density of vGlut-2-positive puncta in the CNF1-treated cortex (t test, p = 0.003). Data are mean ± SEM. **p < 0.01.
Figure 8.
Figure 8.
Effects of CNF1 injection in the normal adult visual cortex. A, C/I VEP ratio is identical in naive, undeprived adult rats (n = 4) and naive rats treated with CNF1 14 d before (n = 4; t test, p = 0.83). Data are mean ± SEM. B, Receptive field size is not altered by CNF1 infusion in naive rats (Mann–Whitney rank-sum test, p = 0.73). Normal, n = 131 cells; CNF1, n = 55 cells.

Similar articles

Cited by

References

    1. Antonucci F, Rossi C, Gianfranceschi L, Rossetto O, Caleo M. Long-distance retrograde effects of botulinum neurotoxin A. J Neurosci. 2008;28:3689–3696. - PMC - PubMed
    1. Arellano JI, Benavides-Piccione R, Defelipe J, Yuste R. Ultrastructure of dendritic spines: correlation between synaptic and spine morphologies. Front Neurosci. 2007;1:131–143. - PMC - PubMed
    1. Belichenko PV, Wright EE, Belichenko NP, Masliah E, Li HH, Mobley WC, Francke U. Widespread changes in dendritic and axonal morphology in Mecp2-mutant mouse models of Rett syndrome: evidence for disruption of neuronal networks. J Comp Neurol. 2009;514:240–258. - PubMed
    1. Berardi N, Pizzorusso T, Maffei L. Critical periods during sensory development. Curr Opin Neurobiol. 2000;10:138–145. - PubMed
    1. Bonhoeffer T, Yuste R. Spine motility. Phenomenology, mechanisms, and function. Neuron. 2002;35:1019–1027. - PubMed

MeSH terms