. 2011 Oct 19;31(42):15205-17.
doi: 10.1523/JNEUROSCI.3092-11.2011.

Different effects of bromodeoxyuridine and [3H]thymidine incorporation into DNA on cell proliferation, position, and fate

Affiliations

Different effects of bromodeoxyuridine and [3H]thymidine incorporation into DNA on cell proliferation, position, and fate

Alvaro Duque et al. J Neurosci. .

Abstract

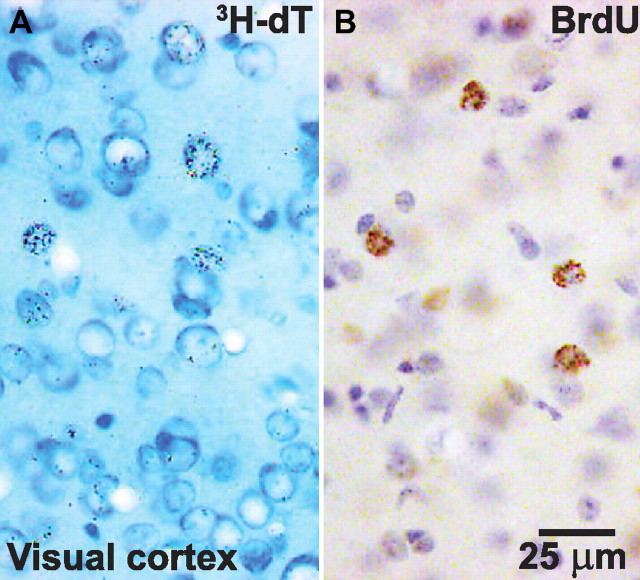
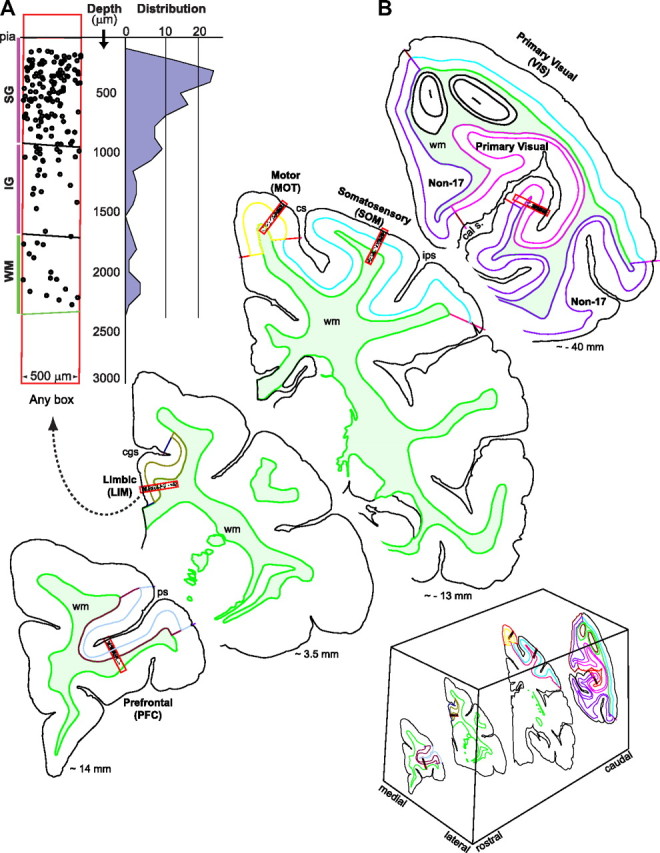
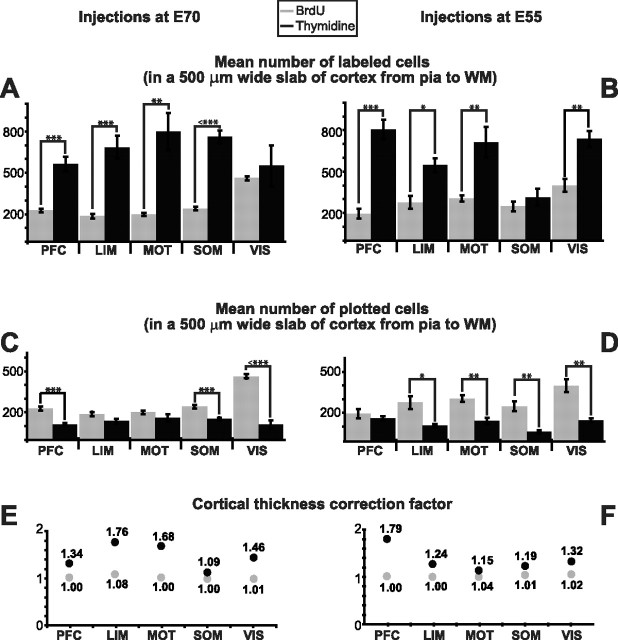
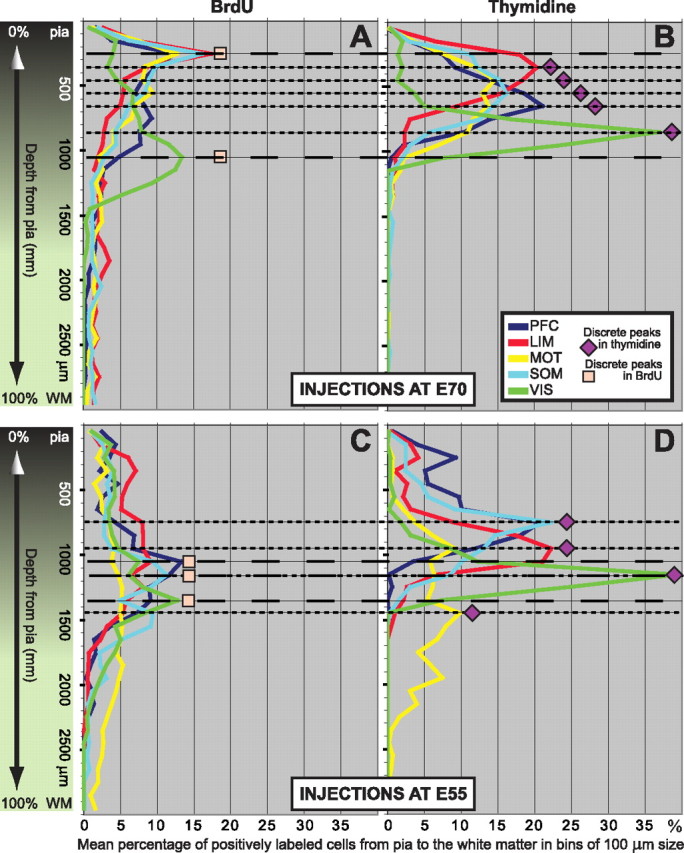
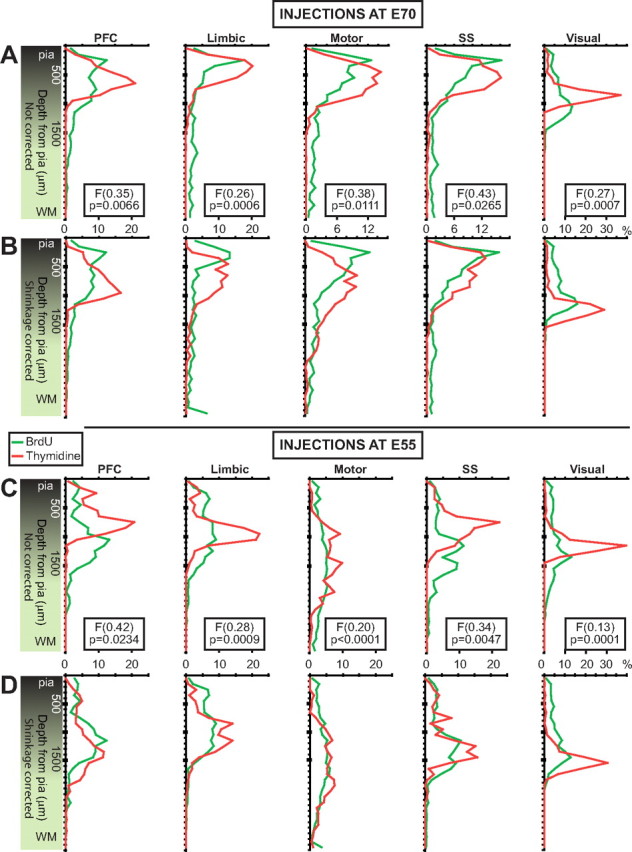
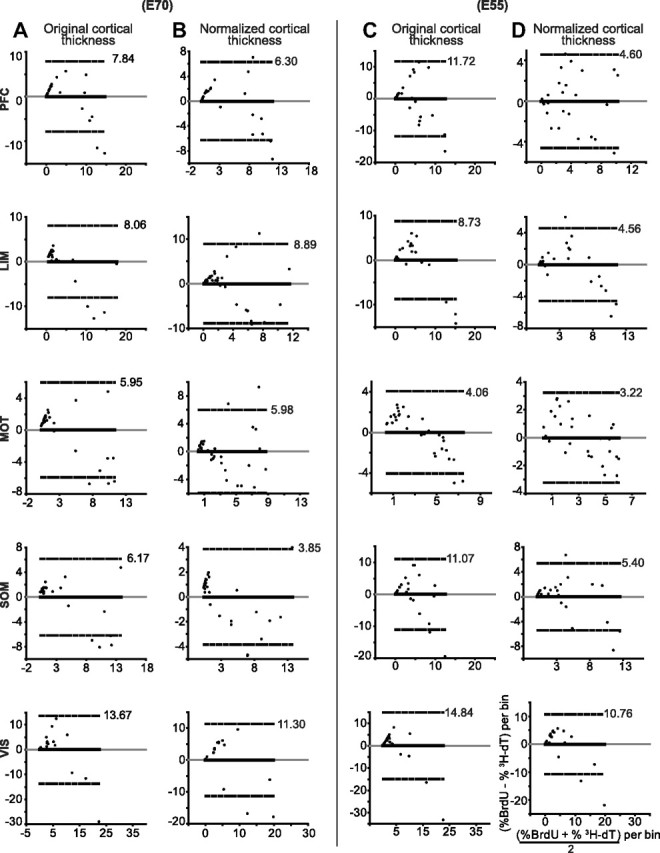
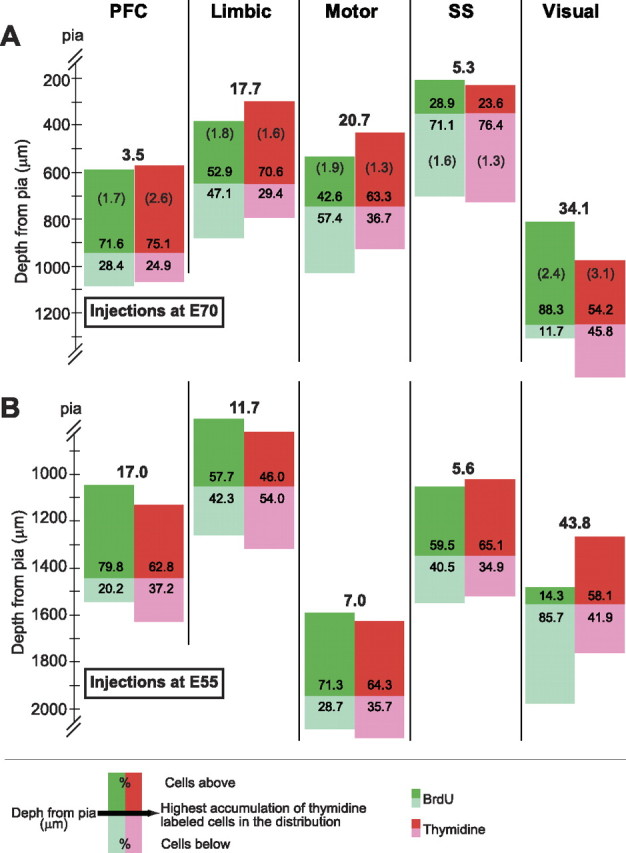
As markers of DNA synthesis, [(3)H]thymidine ([(3)H]dT) and the later developed analog bromodeoxyuridine (BrdU) have revolutionized our ability to identify dividing cells and follow their fate in various tissues, including the nervous system. However, the effect of the incorporation of these molecules into DNA on cell proliferation, migration, differentiation, and function is not fully understood. Here, we compare the number and distribution of labeled cells in the cerebral cortex of postnatal macaque monkeys exposed to either [(3)H]dT or BrdU as embryos. The large size and prolonged brain development in this species allows higher resolution of cellular events and more accurate discrimination between the two methods. Our analysis revealed substantial differences in the number and distribution of labeled cells. The data indicate that random incorporation of the thymidine analog BrdU into the genes of dividing cells makes the fate of postmitotic neurons more prone to unpredictable errors than the incorporation of the more natural DNA constituent nucleotide [(3)H]dT. These findings have implications for the interpretation of results obtained by BrdU as an index of the number of neurons produced, and their migration, placement, subsequent connectivity, function, and survival.


Figures

Figure 1.
Figure 1.
[3H]dT versus BrdU staining. Examples of [3H]dT (A) and BrdU (B) staining in the visual cortex are shown.
Figure 2.
Figure 2.
Sampling strategy. A, B, Hemicoronal sections illustrating approximate rostrocaudal levels and cortical sites where sampling boxes were placed. A random box is illustrated to indicate how cell distributions from pia to the white matter (WM, wm; filled light green color) are generated. The black dots inside boxes represent labeled cells. cal s., Calcarine sulcus; cgs, cingulate sulcus; cs, central sulcus; ips, intraparietal sulcus; ps, principal sulcus; SG, supragranular, IG, infragranular. Values in millimeters indicate approximate distance to bregma according to the atlas of Paxinos et al. (2000). The abbreviations for the five cortical areas studied apply to all other figures and tables.
Figure 3.
Figure 3.
Cell numbers. Labeled (A, B) and plotted (C, D) mean number of BrdU and [3H]dT cells in a 500-μm-wide slab of cortex from pia to WM. Although more BrdU than [3H]dT cells were plotted (C, D) and some of the differences reached statistical significance (ANOVA at the p < 0.05 level); after corrections (E, F) (see Materials and Methods, Technical considerations and corrections of methodological differences), it was determined that there are more [3H]dT than BrdU-labeled cells (A, B). E and F illustrate the factor by which each cortical area was corrected to normalize the cortical thickness to the mean cortical thickness measured in the BrdU cases. Cortical thickness was highly variable in the [3H]dT cases and rather constant in BrdU cases. *Denotes statistical significance. Error bars indicate SEM.
Figure 4.
Figure 4.
BrdU-positive cells are significantly more dispersed than [3H]dT-positive cells. A–D, Distribution plots of the mean percentage BrdU and [3H]dT cells in bins of 100 μm from pia to (and including) WM. As indicated by color gradient, the transition from gray matter to WM is not an abrupt one. WM border usually initiates at ∼1800 μm deep, but this depends on the region, angle of cut, etc. A, B, Injections at E70. A, BrdU peaks for the PFC, LIM, MOT, and SOM cortices coincide in depth between 200 and 300 μm from pia. The peak for VIS cortex is between 1000 and 1100 μm deep. In addition to these peaks, for all BrdU cases there are other quasi-salient peaks at different depths, and in most cases >10% of the cells accumulate deeper to where no [3H]dT cells accumulate. Between 2 and 3% of the cells are found at very deep locations including within the WM (>1900 μm from pia). Because of the spreading of the distributions, the largest accumulation of BrdU cells in a single bin is low, in the range from ∼12 to 17%. B, [3H]dT peaks are discrete (i.e., separate from each other) and compact. In order of depth are LIM (at 300–400 μm), MOT (at 400–500 μm), SOM (at 500–600 μm), PFC (at 600–700 μm), and VIS (at 800–900 μm) cortices. There is no accumulation of cells at deeper locations and no cells found in the WM. Consequently, in each cortical area the largest accumulation of [3H]dT cells in a single bin is high, in the range from ∼15 to 37%. C, D, Injections at E55. C, D, BrdU (C) and [3H]dT (D) distributions are wider when compared with the corresponding ones for injections at E70 but, when compared with each other, BrdU cells (C) are still more dispersed than the corresponding [3H]dT cells (D). As with the E70 cases, the total percentage accumulation per bin for BrdU is consequently lower that of [3H]dT. The spreading of the BrdU cells is therefore a function of the marker and not of the time at which it was injected. To facilitate comparisons, all scales are the same and the position of BrdU or [3H]dT distribution peaks are indicated by long and short dashed lines, respectively.
Figure 5.
Figure 5.
BrdU versus [3H]dT cell dispersion per cortical area. To facilitate comparison, the distributions are now shown per cortical area. Corresponding uncorrected (top) and corrected (bottom) distributions for injections at E70 (A, B) and at E55 (C, D). In all cases, independently of whether or not the cortical thickness is normalized, BrdU and [3H]dT peaks do not coincide in depth from pia. Normalization has little effect on BrdU distributions but decreases the amplitude and deepens (with respect to pia) the peaks of the [3H]dT distributions. [3H]dT distributions are more compact than BrdU distributions indicating that BrdU cells are more widespread. All the F scores for dispersion have significant p values. F scores are not provided for the normalized cases because normalization renders the F test less powerful.
Figure 6.
Figure 6.
Agreement between BrdU and [3H]dT cell distributions is poor. A–D, Bland–Altman difference plots (also called Tukey's mean difference plots) indicate poor agreement between BrdU and [3H]dT distributions for all injection times and in all cortical areas. The smallest limits of agreement with semibalance differences occur in the MOT cortex at E55 probably due to the poor development of the MOT cortex at the time of injection. The widest limits of agreement are all in the VIS cortex (a very active yet undeveloped area for both injection times). Normalization of cortical thickness improves the limits of agreement for most distributions, but limits are still wide. Bias (solid black) and identity (gray) lines are all at zero because the distributions are for normalized (percentage) data. The dashed lines represent the 95% agreement limits, of which only the positive value is shown. Since the 3000-μm-long counting boxes were divided in bins of 100 μm height, each of the 30 dots in each plot represents an ordered pair in which the ordinate is the difference in percentage and the abscissa is the mean percentage for the corresponding bins (i.e., bins at the same depth from pia) of the BrdU and [3H]dT distributions. The coordinate labels in the last plot apply to all plots.
Figure 7.
Figure 7.
Some BrdU cells are lost: they can bypass or lag behind their target positions. We calculated the percentage accumulation of BrdU and [3H]dT cells with respect to the highest peak(s) in the [3H]dT distributions after normalization of cortical thickness per cortical area. The difference (percentage) between the distributions is indicated in bold numbers above them. A, For injections at E70, some BrdU cells lag behind their proper depth in the PFC, LIM, and MOT cortices, while in SOM and VIS cortices they overshoot their target and position themselves more superficially than they should. B, Early on (at E55) the pattern was exactly the opposite, some BrdU cells in the PFC, LIM, and MOT cortices bypass their target depth with reference to pia and position themselves more superficially that they should, while in SOM and VIS cortices they lag behind. The numbers in parentheses (E70 cases; a single pair of animals in each case) indicate that the within-group differences are smaller than the between-group differences for each marker and within each cortical area.

Similar articles

Cited by

References

    1. Altman D, Bland J. Measurement in medicine: the analysis of method comparison studies. Statistician. 1983;32:307–317.
    1. Altman J. Autoradiographic investigation of cell proliferation in the brains of rats and cats. Anat Rec. 1963;145:573–591. - PubMed
    1. Altman J. DNA metabolism and cell proliferation. In: Lajtha A, editor. Handbook of neurochemistry. New York: Plenum; 1969. pp. 137–182.
    1. Angevine JB., Jr Time of neuron origin in the hippocampal region. An autoradiographic study in the mouse. Exp Neurol Suppl. 1965;2:1–70. - PubMed
    1. Bannigan J, Langman J. The cellular effect of 5-bromodeoxyuridine on the mammalian embryo. J Embryol Exp Morphol. 1979;50:123–135. - PubMed

Publication types