. 2012 Feb;29(2):787-96.
doi: 10.1093/molbev/msr250. Epub 2011 Oct 19.

The dynamics and evolutionary potential of domain loss and emergence

Affiliations

The dynamics and evolutionary potential of domain loss and emergence

Andrew D Moore et al. Mol Biol Evol. 2012 Feb.

Abstract

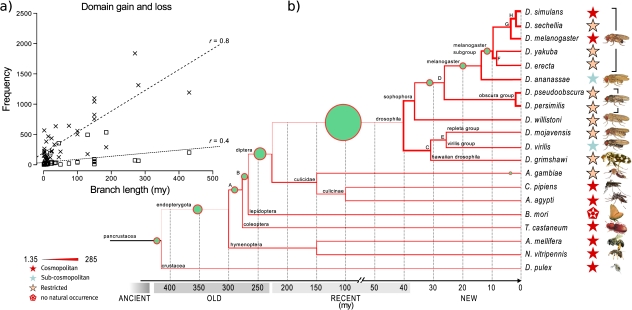
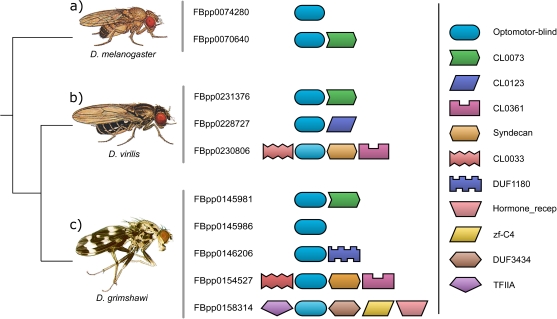
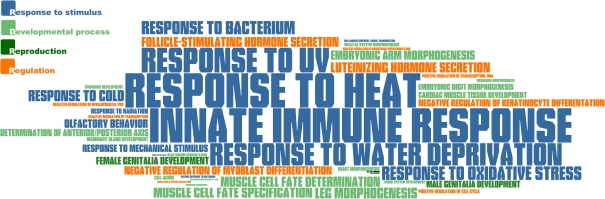
The wealth of available genomic data presents an unrivaled opportunity to study the molecular basis of evolution. Studies on gene family expansions and site-dependent analyses have already helped establish important insights into how proteins facilitate adaptation. However, efforts to conduct full-scale cross-genomic comparisons between species are challenged by both growing amounts of data and the inherent difficulty in accurately inferring homology between deeply rooted species. Proteins, in comparison, evolve by means of domain rearrangements, a process more amenable to study given the strength of profile-based homology inference and the lower rates with which rearrangements occur. However, adapting to a constantly changing environment can require molecular modulations beyond reach of rearrangement alone. Here, we explore rates and functional implications of novel domain emergence in contrast to domain gain and loss in 20 arthropod species of the pancrustacean clade. Emerging domains are more likely disordered in structure and spread more rapidly within their genomes than established domains. Furthermore, although domain turnover occurs at lower rates than gene family turnover, we find strong evidence that the emergence of novel domains is foremost associated with environmental adaptation such as abiotic stress response. The results presented here illustrate the simplicity with which domain-based analyses can unravel key players of nature's adaptational machinery, complementing the classical site-based analyses of adaptation.


Figures

F<sc>IG</sc>. 1.
FIG. 1.
Domain loss, gain, and emergence across 20 species of pancrustacea. (a) Domain gain (squares) and loss (crosses) against branch length. Ancestral domain content was reconstructed using a parsimony-based approach. Events were inferred along each branch of the tree. Domain loss correlates well with branch length (Pearson r = 0.808, P ≪ 0.001). (b) Domain loss and emergence along branches. Nonclassified common ancestors are labeled A–H. Line strength corresponds to rate of domain loss per My along the respective branch. Domain emergence is indicated by green circles scaled to the number of emergence events along the respective branch (see also Table 1). Tree and approximate divergence times are based on Honeybee Genome Sequencing Consortium (2006) and Hedges et al. (2006).
F<sc>IG</sc>. 2.
FIG. 2.
Arrangements of OMB domains in three species of Drosophila. Domains are represented as shapes; OMB is shown as oval box. The E value cutoff for the presented arrangements is ≤ 0.01. (a) Drosophila melanogaster has two different arrangements with OMB, one of which includes the T-box domain (arrow-shaped polygon, member of Pfam clan CL0073). The majority of species share the latter arrangement. (b) Drosophila virilis has a slightly different morphology and has three arrangements with OMB, where one instance is found in a region of domain overlap. (c) Drosophila grimshawi exhibits a strikingly different morphology and has, as the only species of Drosophila, a total of five arrangements that contain traces of omb where it cooccurs or overlaps with domains that have been implicated in growth, development, and transcriptional regulation.
F<sc>IG</sc>. 3.
FIG. 3.
P value transformed TermLogo of functional groups with emerging domains. GO terms effected by emergence were subject to an overrepresentation analysis with the weighted algorithm of the TopGO package and using all GO terms present in pancrustacea as universe (see Methods). The size of the font corresponds to the strength of significance obtained for the term. Significance was established after correction for multiple testing using Bonferroni at P < 0.01. The color coding corresponds to parental nodes in the GO graph. The majority of the significant terms are related to stimulus response. Only the term “cell adhesion,” displayed in black, is not included in one of the four categories displayed in the top left as parent node.

Similar articles

Cited by

References

    1. Alexa A, Rahnenführer J, Lengauer T. Improved scoring of functional groups from gene expression data by decorrelating go graph structure. Bioinformatics. 2006;22:1600–1607. - PubMed
    1. Apic G, Gough J, Teichmann SA. Domain combinations in archaeal, eubacterial and eukaryotic proteomes. J Mol Biol. 2001;310:311–325. - PubMed
    1. Baines JF, Sawyer SA, Hartl DL, Parsch J. Effects of x-linkage and sex-biased gene expression on the rate of adaptive protein evolution in drosophila. Mol Biol Evol. 2008;25:1639–1650. - PMC - PubMed
    1. Björklund AK, Ekman D, Light S, Frey-Skött J, Elofsson A. Domain rearrangements in protein evolution. J Mol Biol. 2005;353:911–923. - PubMed
    1. Bornberg-Bauer E, Huylmans AK, Sikosek T. How do new proteins arise? Curr Opin Struct Biol. 2010;20:390–396. - PubMed

Publication types