. 2011;6(10):e25807.
doi: 10.1371/journal.pone.0025807. Epub 2011 Oct 10.

CAFET algorithm reveals Wnt/PCP signature in lung squamous cell carcinoma

Affiliations

CAFET algorithm reveals Wnt/PCP signature in lung squamous cell carcinoma

Yue Hu et al. PLoS One. 2011.

Abstract

We analyzed the gene expression patterns of 138 Non-Small Cell Lung Cancer (NSCLC) samples and developed a new algorithm called Coverage Analysis with Fisher's Exact Test (CAFET) to identify molecular pathways that are differentially activated in squamous cell carcinoma (SCC) and adenocarcinoma (AC) subtypes. Analysis of the lung cancer samples demonstrated hierarchical clustering according to the histological subtype and revealed a strong enrichment for the Wnt signaling pathway components in the cluster consisting predominantly of SCC samples. The specific gene expression pattern observed correlated with enhanced activation of the Wnt Planar Cell Polarity (PCP) pathway and inhibition of the canonical Wnt signaling branch. Further real time RT-PCR follow-up with additional primary tumor samples and lung cancer cell lines confirmed enrichment of Wnt/PCP pathway associated genes in the SCC subtype. Dysregulation of the canonical Wnt pathway, characterized by increased levels of β-catenin and epigenetic silencing of negative regulators, has been reported in adenocarcinoma of the lung. Our results suggest that SCC and AC utilize different branches of the Wnt pathway during oncogenesis.


Conflict of interest statement

Competing Interests: The authors have declared that no competing interests exist.

Figures

Figure 1
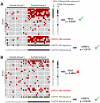
Figure 1. Schematic illustration of the FGA and CAFET approaches for pathway enrichment.
Both the FGA and CAFET approaches begin with the same data matrix of gene expression measurements, and both seek to assess the relevance of a particular Functional Gene Set (FGS) (i.e., pathway) in the division of samples into two groups. Red boxes indicate dysregulation of a specific gene in a specific sample. FGA approaches employ a three-step process. In step 1, differentially expressed genes are identified, typically based on a t-test or ANOVA analysis. In step 2, genes with a role the FGS of interest are identified. In step 3, Fisher’s exact test is used to test for enrichment of FGS genes among differentially-expressed genes. CAFET employs a similar four-step process. In step 1, FGS genes are first identified and the corresponding sub-matrix is extracted. In step 2, samples are evaluated for the presence of a particular gene expression signature. In this study, the signature is marked as present if one or more pathway genes are dysregulated. In step 3, the division of samples between two groups of interest is defined. In step 4, Fisher’s exact test is used to test for enrichment of samples containing the pathway signature among the sample group of interest. In cases where the majority of FGS members are differentially regulated (A), both FGA and CAFET detect a statistically significant relationship between the FGS and the sample grouping. However, in cases where each sample has only a few FGS members dysregulated (B), CAFET but not FGA results in a significant enrichment for the associated FGS.
Figure 2
Figure 2. Hierarchical clustering of 138 NSCLC samples reveals two predominant sample clusters.
Hierarchical clustering was performed based on log-transformed expression data using Euclidean distance and average linkage. The brown branches of the tree were labeled “Group 1”, and the light blue cluster was labeled “Group 2”. Group 2 was further subdivided into Group 2a (dark blue) and Group 2b (red).
Figure 3
Figure 3. Mapping gene expression changes on the Wnt pathway revealed strong upregulation of PCP signaling and downregulation of canonical signaling.
The three branches of Wnt signaling are shown –calcium (pink background), beta-catenin (green background), and PCP (blue background). Up/down arrows indicate overexpression and downregulation, respectively, in Group 1 samples. Genes whose expression change is consistent with canonical pathway inhibition and PCP pathway activation are colored red. Those genes promoting canonical signaling and inhibiting the PCP branch are colored green. Genes with no significant change in expression, or whose expression change has no selectivity between the canonical and non-canonical branches are colored white. The down-regulation of CAMK2D and PRKCA (dark blue) acts to inhibit Wnt Ca2+ signaling.
Figure 4
Figure 4. Differential expression pattern of Wnt signature genes in lung cancer samples.
Each column represents one of the 138 lung cancer samples as ordered in Fig 1. SCC samples are colored brown and AC samples are colored blue. Each row represents a Wnt pathway gene in Table 2, ranked according to p-value. Red and blue cells indicate overexpression and down-regulation, respectively, of individual genes in specific samples.
Figure 5
Figure 5. Confirmation of Wnt/PCP signature in SCC of lung.
A) Activation of Wnt/PCP signaling in SCC of lung was confirmed in a second independent expression data set. Samples from an additional lung cancer data set were also evaluated for Wnt/PCP signaling using the same scoring system applied to the initial data set. Results showed a strong enrichment of SCC among high-scoring samples. B) Quantitative PCR was also done on three Wnt pathway genes (FZD6, DVL3, WNT5A) in 40 commercially-obtained lung cancer samples. The expression of WNT5A and FZD6were significantly higher in SCC samples. C) RT-PCR confirmed overexpression of Wnt pathway components in SCC of lung. The expression of nine genes in the Wnt pathway was measured in 12 SCC and 12 non-SCC lung samples. All expression measurements were relative to matched normal lung samples. These data showed consistent upregulation in SCC relative to non-SCC samples. Actin was used as a control for normalization.

References

    1. Borczuk AC, Toonkel RL, Powell CA. Genomics of lung cancer. Proc Am Thorac Soc. 2009;6:152–158. - PMC - PubMed
    1. Curtis RK, Oresic M, Vidal-Puig A. Pathways to the analysis of microarray data. Trends Biotechnol. 2005;23:429–435. - PubMed
    1. Werner T. Bioinformatics applications for pathway analysis of microarray data. Curr Opin Biotechnol. 2008;19:50–54. - PubMed
    1. Hosack DA, Dennis G, Sherman BT, Lane HC, Lempicki RA. Identifying biological themes within lists of genes with EASE. Genome Biol. 2003;4:R70. - PMC - PubMed
    1. Subramanian A, Tamayo P, Mootha VK, Mukherjee S, Ebert BL, et al. Gene set enrichment analysis: a knowledge-based approach for interpreting genome-wide expression profiles. Proc Natl Acad Sci U S A. 2005;102:15545–15550. - PMC - PubMed