. 2011;6(10):e25888.
doi: 10.1371/journal.pone.0025888. Epub 2011 Oct 10.

Acylpeptide hydrolase inhibition as targeted strategy to induce proteasomal down-regulation

Affiliations

Acylpeptide hydrolase inhibition as targeted strategy to induce proteasomal down-regulation

Gianna Palmieri et al. PLoS One. 2011.

Abstract

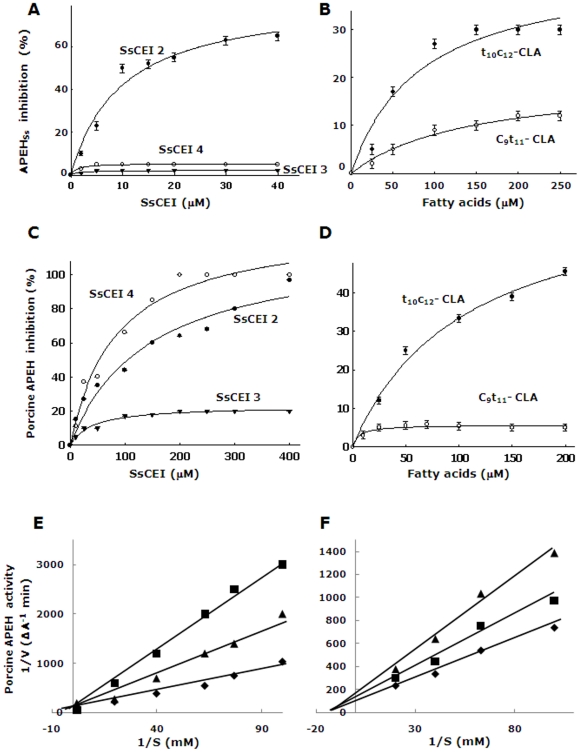
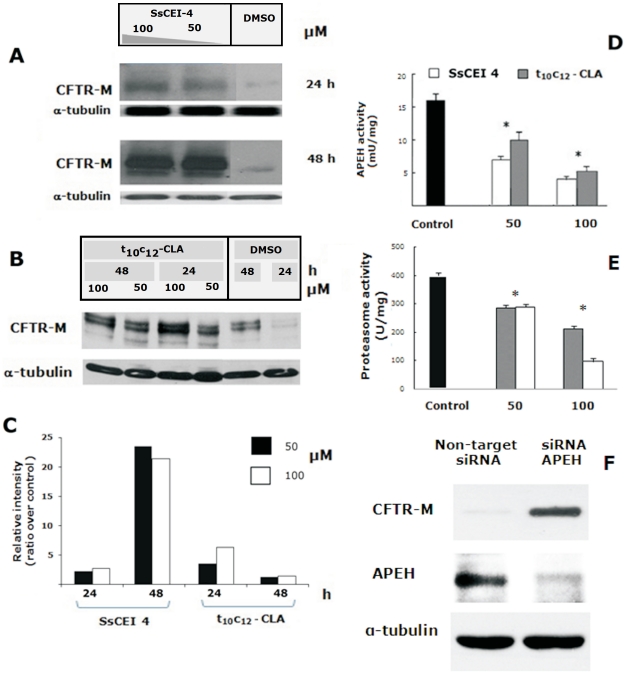
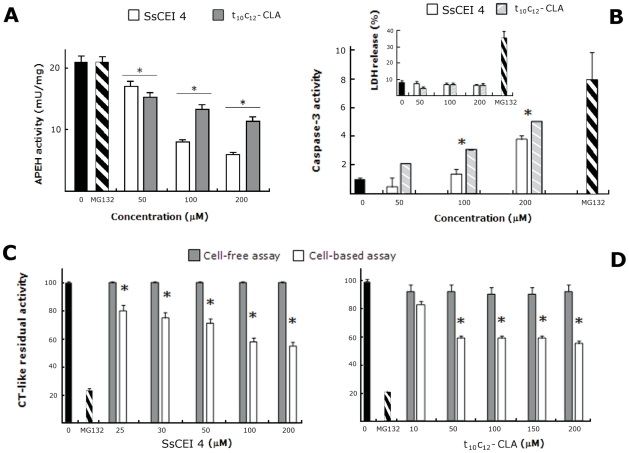
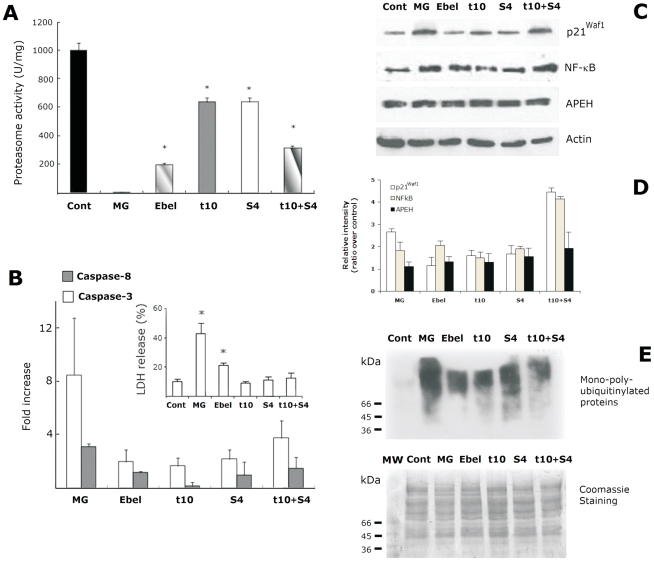
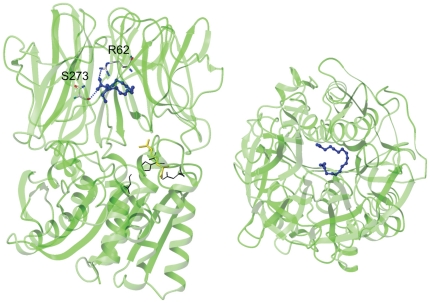
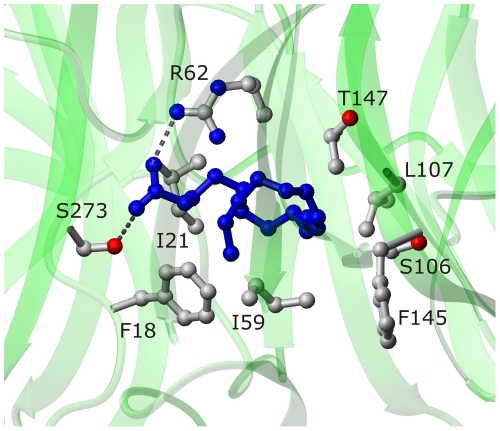
Acylpeptide hydrolase (APEH), one of the four members of the prolyl oligopeptidase class, catalyses the removal of N-acylated amino acids from acetylated peptides and it has been postulated to play a key role in protein degradation machinery. Disruption of protein turnover has been established as an effective strategy to down-regulate the ubiquitin-proteasome system (UPS) and as a promising approach in anticancer therapy.Here, we illustrate a new pathway modulating UPS and proteasome activity through inhibition of APEH. To find novel molecules able to down-regulate APEH activity, we screened a set of synthetic peptides, reproducing the reactive-site loop of a known archaeal inhibitor of APEH (SsCEI), and the conjugated linoleic acid (CLA) isomers. A 12-mer SsCEI peptide and the trans10-cis12 isomer of CLA, were identified as specific APEH inhibitors and their effects on cell-based assays were paralleled by a dose-dependent reduction of proteasome activity and the activation of the pro-apoptotic caspase cascade. Moreover, cell treatment with the individual compounds increased the cytoplasm levels of several classic hallmarks of proteasome inhibition, such as NFkappaB, p21, and misfolded or polyubiquitinylated proteins, and additive effects were observed in cells exposed to a combination of both inhibitors without any cytotoxicity. Remarkably, transfection of human bronchial epithelial cells with APEH siRNA, promoted a marked accumulation of a mutant of the cystic fibrosis transmembrane conductance regulator (CFTR), herein used as a model of misfolded protein typically degraded by UPS. Finally, molecular modeling studies, to gain insights into the APEH inhibition by the trans10-cis12 CLA isomer, were performed.Our study supports a previously unrecognized role of APEH as a negative effector of proteasome activity by an unknown mechanism and opens new perspectives for the development of strategies aimed at modulation of cancer progression.


Conflict of interest statement

Competing Interests: The authors have declared that no competing interests exist.

Figures

Figure 1
Figure 1. Kinetic analysis of SsCEIs and CLA isomers towards APEHs.
Binding of increasing concentrations of the SsCEI peptides (A), and CLA isomers (B) to APEHSs. Binding of SsCEI peptides (C), and t10c12-CLA (D) to porcine APEH. The hyperbolic curves indicate the best fits for the data obtained, with IC50 values calculated from the graphs. Inhibition kinetics analyses with porcine APEH (0.5 nM) at increasing SsCEI 4 concentrations: 100 µM (triangles) and 150 µM (squares) (E). Similarly, inhibition kinetics by increasing t10c12-CLA concentrations: 50 µM (squares) and 100 µM (triangles) (F). Enzyme incubated without inhibitors were used as control (diamonds) (E, F). The inhibition constants, Ki, were determined by the Lineweaver–Burk equation for competitive and non-competitive inhibition, respectively.
Figure 2
Figure 2. Analysis of the CFTR-M protein accumulation in BHK cells treated with the SsCEI 4 and t10c12-CLA and in APEH siRNA transfected CFBE41o-DF cells.
Representative Immunoblots and associated densitometric analysis for cytosolic CFTR-M accumulation in BHK cells following 24 h and 48 h exposure to 50 µM or 100 µM SsCEI 4 (A), and to 50 µM or 100 µM t10c12-CLA (B). Bands were quantified using densitometric analysis and normalized against α-tubulin. The values were expressed as average fold increase as compared to untreated culture (C). APEH activity was measured in BHK cells incubated with 50 µM and 100 µM SsCEI 4 (white bars) or t10c12-CLA (grey bars) for 48 h (D). CT-like proteasome activities were measured in BHK cells incubated with 50 µM and 100 µM SsCEI 4 (white bars) or t10c12-CLA (gray bars) for 48 h (E). Untreated cultures were used as controls (black bars); the data are expressed as means±SD. *Significantly different (P<0.005) from the control (D, E). Representative Immunoblots of APEH and CFTR-M accumulation in CFBE41o-DF cells transfected with APEH siRNA. A scrambled, non-targeted siRNA, was used as negative control and α-tubulin was used as loading control (F).
Figure 3
Figure 3. Down-regulation of the proteasome/APEH enzyme system by the SsCEI 4 and t10c12-CLA in Caco-2 cells.
APEH activity was measured in Caco-2 cells incubated with 50 µM, 100 µM and 200 µM SsCEI 4 (white bars) or t10c12-CLA (gray bars) for 48 h (A). Proteasomal CT-like activity was measured in cell-free system (a partially purified proteasome fraction from differentiated Caco-2 cells, gray bars) and in Caco-2 cells (white bars) treated with increasing concentrations of SsCEI 4 (C) or t10c12-CLA (D). Caspase-3 activities and LDH release were measured upon 48 h incubations of Caco-2 cells with increasing concentrations of SsCEI 4 (white bars) and t10c12-CLA (striped grey bars) (B). The cytotoxic effect of the different treatments was evaluated by measuring the LDH release in the culture media (B insert). Cell-free protein mixtures, or Caco-2 cell cultures, treated with DMSO alone (black bars) or with MG132 (10 µM) (striped black bars) were used as positive controls. The data are expressed as means±SD. *Significantly different (P<0.005) from respective controls.
Figure 4
Figure 4. Evaluation of proteasome inhibition markers in Caco-2 cells incubated with SsCEI-4 and t10c12-CLA, alone or in combination.
Caco-2 cells were treated (48 h) with 10 µM MG132 (MG), 100 µM ebelactone (Ebel), 200 µM SsCEI 4 (S4), t10c12-CLA (t10), or with a mixture of both (t10+S4). Cells exposed to DMSO alone were used as the controls (black bar). The data are expressed as means±SD. *Significantly different (P<0.005) from the control (A). Caspase-3 (white bars) and caspase-8 (grey bars) activities measured as fold increase in comparison to untreated cells (B). The cytotoxic effect of the different treatments was evaluated by measuring the LDH release in the culture media (B insert). Representative immunoblots of the expression of p21Waf1, NF-κB, and APEH in Caco-2 cell exposed for 48 h to MG, Ebel, S4, t10 or with a mixture of both (t10+S4) (C). Data on Western blot analysis are expressed as the density ratio of target to control (β-actin) in arbitrary units. The values were expressed as average relative intensity as compared to untreated cultures and expressed as means±SD of measurements performed in triplicate (D). Protein ubiquitinylation in Caco-2 cell exposed for 48 h to MG, Ebel, S4, t10 or with a mixture of both (t10+S4) (E, upper panel). Upon the immunodetection, the membrane was stained with Coomassie blue. The lane loaded with molecular mass markers [MW kDa] was shown (lower panel).
Figure 5
Figure 5. Binding mode of the t10c12-CLA with APEHSs.
Binding mode suggested by docking analysis for t10c12-CLA (blue; ball-and-stick mode) with APEHSs (cartoon representation; green, left). Protein residues involved in stabilising the interactions with the carboxylic group of the t10c12-CLA are represented as sticks. The Ser-Asp-His catalytic triad residues are shown as black lines; R507 is shown in yellow. (right) View rotated 90° along the x-axis (the horizontal axis parallel to the image plane).
Figure 6
Figure 6. Suggested binding site on APEHSs.by docking analysis for the t10c12-CLA (blue; ball-and-stick mode) isomer.
The relevant APEHSs residues are shown in ball-and-stick representation.

Similar articles

Cited by

References

    1. Ciechanover A. Proteolysis: from the lysosome to ubiquitin and the proteasome. Nat Rev Mol Cell Biol. 2005;6:79–87. - PubMed
    1. Schwartz AL, Ciechanover A. Targeting proteins for destruction by the ubiquitin system: implications for human pathobiology. Annu Rev Pharmacol Toxicol. 2009;49:73–96. - PubMed
    1. Shah IM, Di Napoli M. The ubiquitin-proteasome system and proteasome inhibitors in central nervous system diseases. Cardiovasc Hematol Disord Drug Targets. 2007;7:250–273. - PubMed
    1. Rajkumar SV, Richardson PG, Hideshima T, Anderson KC. Proteasome inhibition as a novel therapeutic target in human cancer. J Clin Oncol. 2005;23:630–639. - PubMed
    1. Naujokat C, Sezer O, Zinke H, Leclere A, Hauptmann S, et al. Proteasome inhibitors induced caspase-dependent apoptosis and accumulation of p21WAF1/Cip1 in human immature leukemic cells. Eur J Haematol. 2000;65:221–236. - PubMed

Publication types

MeSH terms