

Smaller genetic risk in catabolic process explains lower energy expenditure, more athletic capability and higher prevalence of obesity in Africans
- PMID: 22016803
- PMCID: PMC3189926
- DOI: 10.1371/journal.pone.0026027
Smaller genetic risk in catabolic process explains lower energy expenditure, more athletic capability and higher prevalence of obesity in Africans
Abstract
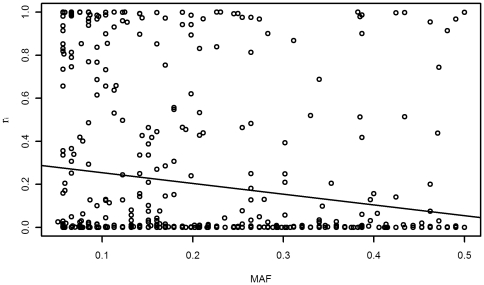
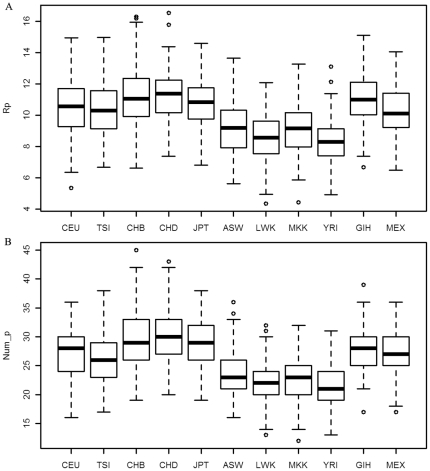
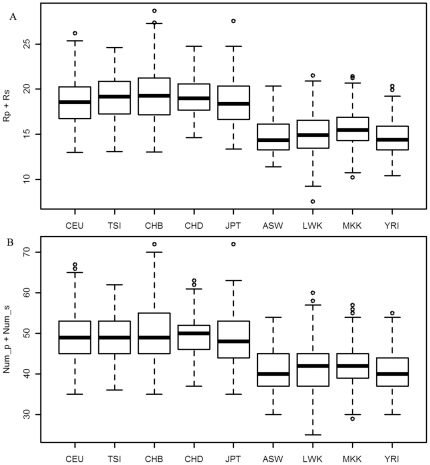
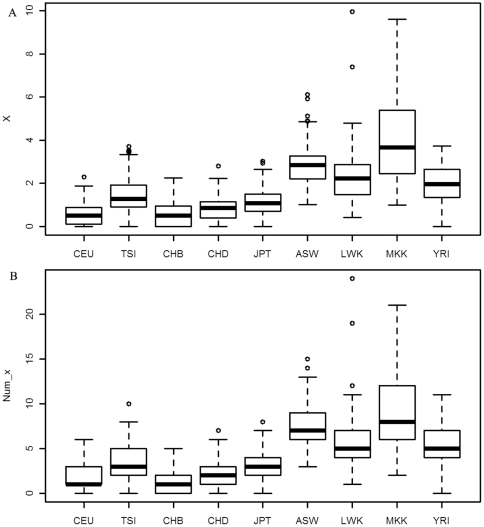
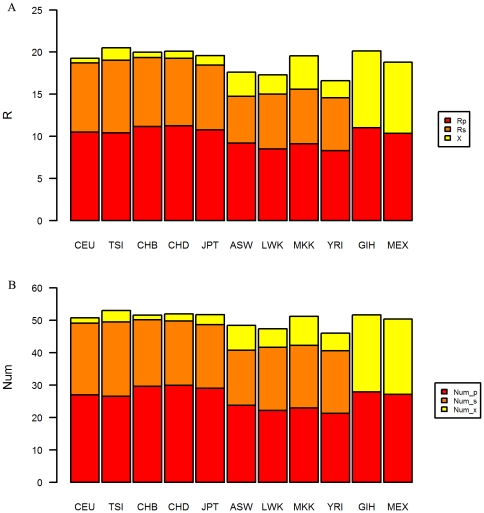
Lower energy expenditure (EE) for physical activity was observed in Africans than in Europeans, which might contribute to the higher prevalence of obesity and more athletic capability in Africans. But it is still unclear why EE is lower among African populations. In this study we tried to explore the genetic mechanism underlying lower EE in Africans. We screened 231 common variants with possibly harmful impact on 182 genes in the catabolic process. The genetic risk, including the total number of mutations and the sum of harmful probabilities, was calculated and analyzed for the screened variants at a population level. Results of the genetic risk among human groups showed that most Africans (3 out of 4 groups) had a significantly smaller genetic risk in the catabolic process than Europeans and Asians, which might result in higher efficiency of generating energy among Africans. In sport competitions, athletes need massive amounts of energy expenditure in a short period of time, so higher efficiency of energy generation might help make African-descendent athletes more powerful. On the other hand, higher efficiency of generating energy might also result in consuming smaller volumes of body mass. As a result, Africans might be more vulnerable to obesity compared to the other races when under the same or similar conditions. Therefore, the smaller genetic risk in the catabolic process might be at the core of understanding lower EE, more athletic capability and higher prevalence of obesity in Africans.
Conflict of interest statement
Figures
 10−5.
10−5.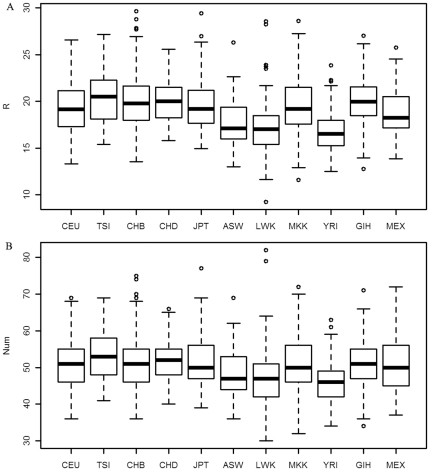
References
-
- Lomax ME. Sports and the Racial Divide: African American and Latino Experience in an Era of Change. Mississippi: University Press of Mississippi; 2008.
-
- Geissler CA, Aldouri MS. Racial differences in the energy cost of standardised activities. Ann Nutr Metab. 1985;29:40–47. - PubMed
-
- DeLany JP, Bray GA, Harsha DW, Volaufova J. Energy expenditure in preadolescent African American and white boys and girls: the Baton Rouge Children's Study. Am J Clin Nutr. 2002;75:705–713. - PubMed
-
- DeLany JP, Bray GA, Harsha DW, Volaufova J. Energy expenditure in African American and white boys and girls in a 2-y follow-up of the Baton Rouge Children's Study. Am J Clin Nutr. 2004;79:268–773. - PubMed
-
- Gannon B, DiPietro L, Poehlman ET. Do African Americans have lower energy expenditure than Caucasians? Int J Obes Relat Metab Disord. 2000;24:4–13. - PubMed
Publication types
MeSH terms
LinkOut - more resources
Full Text Sources
Medical
Research Materials
