. 2011;6(10):e26058.
doi: 10.1371/journal.pone.0026058. Epub 2011 Oct 10.

Joint binding of OTX2 and MYC in promotor regions is associated with high gene expression in medulloblastoma

Affiliations

Joint binding of OTX2 and MYC in promotor regions is associated with high gene expression in medulloblastoma

Jens Bunt et al. PLoS One. 2011.

Abstract

Both OTX2 and MYC are important oncogenes in medulloblastoma, the most common malignant brain tumor in childhood. Much is known about MYC binding to promoter regions, but OTX2 binding is hardly investigated. We used ChIP-on-chip data to analyze the binding patterns of both transcription factors in D425 medulloblastoma cells. When combining the data for all promoter regions in the genome, OTX2 binding showed a remarkable bi-modal distribution pattern with peaks around -250 bp upstream and +650 bp downstream of the transcription start sites (TSSs). Indeed, 40.2% of all OTX2-bound TSSs had more than one significant OTX2-binding peak. This OTX2-binding pattern was very different from the TSS-centered single peak binding pattern observed for MYC and other known transcription factors. However, in individual promoter regions, OTX2 and MYC have a strong tendency to bind in proximity of each other. OTX2-binding sequences are depleted near TSSs in the genome, providing an explanation for the observed bi-modal distribution of OTX2 binding. This contrasts to the enrichment of E-box sequences at TSSs. Both OTX2 and MYC binding independently correlated with higher gene expression. Interestingly, genes of promoter regions with multiple OTX2 binding as well as MYC binding showed the highest expression levels in D425 cells and in primary medulloblastomas. Genes within this class of promoter regions were enriched for medulloblastoma and stem cell specific genes. Our data suggest an important functional interaction between OTX2 and MYC in regulating gene expression in medulloblastoma.


Conflict of interest statement

Competing Interests: The authors have declared that no competing interests exist.

Figures

Figure 1
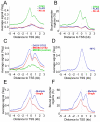
Figure 1. OTX2 binding reveals a bi-modal distribution surrounding transcription start sites.
A. Graphical representation of the average 2log signal of OTX2 ChIP-on-chip data in D425 medulloblastoma cells (green line) as a function of the distance to the transcription start site (TSS). OTX2 binding displays a bi-modal distribution, which is absent in the controls using a FLAG or no antibody (blue and red line, respectively). B. The percentage of promoter regions with OTX2-binding peaks were plotted as a function of the distance to the TSS. This also shows a bi-modal distribution of OTX2. C. A bi-modal distribution of OTX2 binding was also found using OTX2 ChIP-on-chip data from MED8A and DAOY medulloblastoma cell lines with ectopic OTX2 overexpression (red and blue lines, respectively). MED8A cells without OTX2 (green line) did not show this pattern. D. Average MYC binding in D425 cells peaks at the TSS. E. Average OTX2-binding signal plotted separately for promoter regions with single (red line) or multiple OTX2-binding peaks (blue line). F. Percentage of bound promoters as a function of the distance from the TSS for promoters with single OTX2-binding peaks (red line) and promoters with multiple OTX2-binding peaks (blue line).
Figure 2
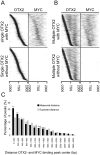
Figure 2. OTX2 and MYC bind close to each other in promoter regions.
For each of the four classes of promoter regions, the 2log binding signals of OTX2- and MYC-binding peaks are shown. Promoter regions are sorted by the location of the first upstream OTX2-binding peak. A. Both classes with a single OTX2-binding peak have a very similar OTX2-binding pattern. When MYC is also bound the MYC-binding peaks closely follow the OTX2 pattern. B. Promoter regions with multiple OTX2-binding peaks. MYC-binding peaks again accumulate there where OTX2 is bound. C. The distances between OTX2- and MYC-binding peak centers were calculated for all promoter regions with single OTX2 binding with MYC binding. The percentage of OTX2-binding peaks within different distance ranges was plotted. Data show that significantly more peaks are close to each other (within 400 bp from each other) then expected (* <0.05, ** <0.0005, Fisher's exact test). Expected distance was generated by multiple randomization of the OTX2 position.
Figure 3
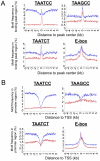
Figure 3. OTX2 motifs enriched at OTX2 peak centers, but not at TSSs.
A. The percentage of the OTX2-binding motifs (TAATCC, TAAGCC and TAATCT) per 50 bp were plotted in regards to the OTX2-binding peak center. For all three motifs, enrichment at the center of OTX2-binding peaks is observed, although for TAATCC this was more apparent in repeat masked data (red) compared to unmasked data (blue). Similar results were obtained for the E-box sequences in the MYC experiment. B. The presence of OTX2- and MYC-binding motifs was scored per 50 bp for all promoter regions in the genome. While E-box sequences display a higher frequency near TSSs in the genome, TAATCC, TAAGCC and TAATCT do not. They all show a clear depletion near TSSs, which is most clear in data without repeat mask (blue lines) as compared to data with repeat mask (red lines).
Figure 4
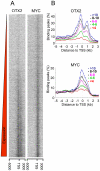
Figure 4. Both OTX2 and MYC binding correlate with high gene expression.
A. All individual promoter regions were ordered by expression level of the associated gene in D425 cells and the corresponding 2log binding signals of OTX2 and MYC in D425 cells were visualized. Both OTX2 and MYC binding positively correlates with gene expression. B. All promoter regions were categorized into five categories by 2log expression values of the corresponding genes. With increasing expression the percentage of bound promoter regions also increases both for OTX2 and MYC. Overall distribution patterns do not change.
Figure 5
Figure 5. OTX2-binding motifs do not correlate with gene expression levels.
All OTX2-binding peaks were sorted by the expression in D425 cells of the associated genes and binned per 400. The motif frequency for each bin is displayed as a function of average expression. For all three OTX2-binding motifs, there is no relation between gene expression levels and motif occurrence within the peaks.
Figure 6
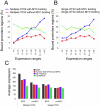
Figure 6. Multiple OTX2-binding peaks with MYC binding is associated with high gene expression.
A and B. OTX2-bound promoter regions are classified by single or multiple OTX2-binding peaks with or without additional MYC-binding. For each of these promoter classes the percentage of bound promoter regions was calculated in different expression categories using either expression data from D425 cells (A) or expression data from 10 primary medulloblastoma tumors that have both OTX2 and MYC expression (B). Promoter regions with multiple OTX2-binding peaks and MYC binding were clearly enriched among the gene categories that show higher gene expression both in D425 cells and in tumors. C. Genes within the promoter class with multiple OTX2-binding peaks and MYC binding showed significantly higher expression levels in D425 cells, primary medulloblastoma tumors and human neural embryonic stem cells as compared to genes in other classes (minimal p<1.00E-7, T-test). This difference was not observed using expression data of normal cerebellum.

Similar articles

Cited by

References

    1. de Haas T, Oussoren E, Grajkowska W, Perek-Polnik M, Popovic M, et al. OTX1 and OTX2 expression correlates with the clinicopathologic classification of medulloblastomas. J Neuropathol Exp Neurol. 2006;65:176–186. - PubMed
    1. Michiels EM, Oussoren E, Van Groenigen M, Pauws E, Bossuyt PM, et al. Genes differentially expressed in medulloblastoma and fetal brain. Physiol Genomics. 1999;1:83–91. - PubMed
    1. Di C, Liao S, Adamson DC, Parrett TJ, Broderick DK, et al. Identification of OTX2 as a medulloblastoma oncogene whose product can be targeted by all-trans retinoic acid. Cancer Res. 2005;65:919–924. - PubMed
    1. Boon K, Eberhart CG, Riggins GJ. Genomic amplification of orthodenticle homologue 2 in medulloblastomas. Cancer Res. 2005;65:703–707. - PubMed
    1. Kool M, Koster J, Bunt J, Hasselt NE, Lakeman A, et al. Integrated genomics identifies five medulloblastoma subtypes with distinct genetic profiles, pathway signatures and clinicopathological features. PLoS One. 2008;3:e3088. - PMC - PubMed

Publication types

MeSH terms