. 2011 Aug-Sep;13(5-6):474-85.
doi: 10.1111/j.1399-5618.2011.00941.x.

The transcription factor SP4 is reduced in postmortem cerebellum of bipolar disorder subjects: control by depolarization and lithium

Affiliations

The transcription factor SP4 is reduced in postmortem cerebellum of bipolar disorder subjects: control by depolarization and lithium

Raquel Pinacho et al. Bipolar Disord. 2011 Aug-Sep.

Abstract

Objectives: Regulation of gene expression is important for the development and function of the nervous system. However, the transcriptional programs altered in psychiatric diseases are not completely characterized. Human gene association studies and analysis of mutant mice suggest that the transcription factor specificity protein 4 (SP4) may be implicated in the pathophysiology of psychiatric diseases. We hypothesized that SP4 levels may be altered in the brain of bipolar disorder (BD) subjects and regulated by neuronal activity and drug treatment.

Methods: We analyzed messenger RNA (mRNA) and protein levels of SP4 and SP1 in the postmortem prefrontal cortex and cerebellum of BD subjects (n = 10) and controls (n = 10). We also examined regulation of SP4 mRNA and protein levels by neuronal activity and lithium in rat cerebellar granule neurons.

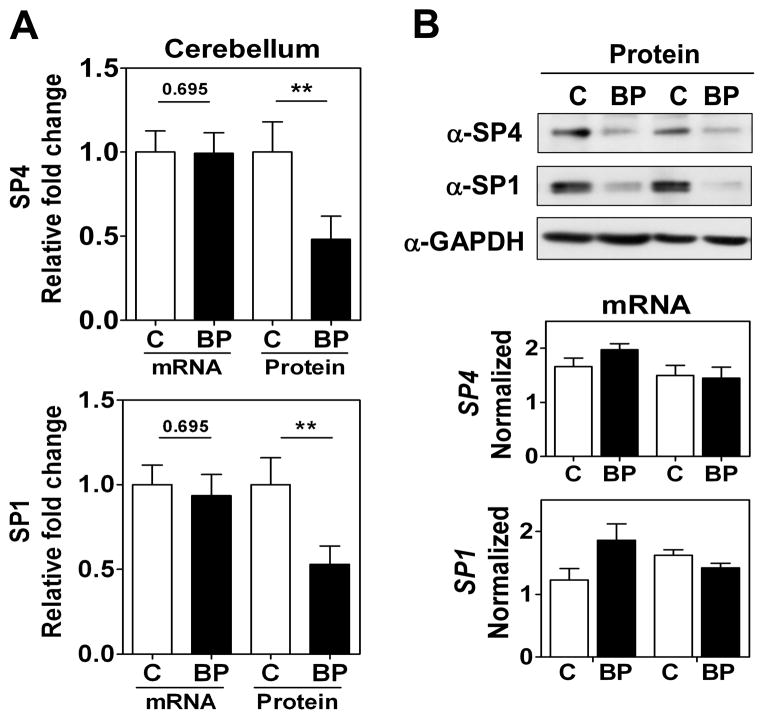
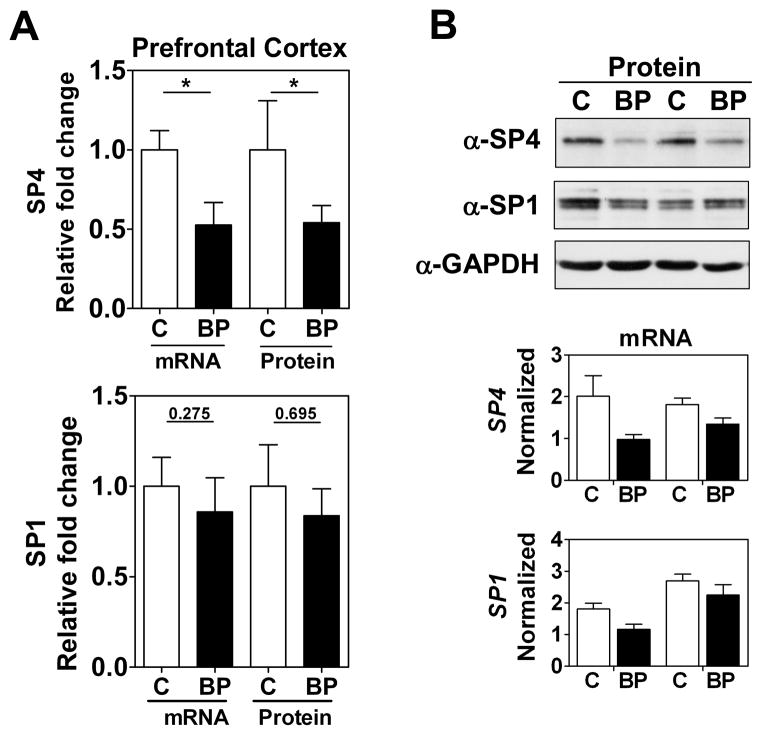
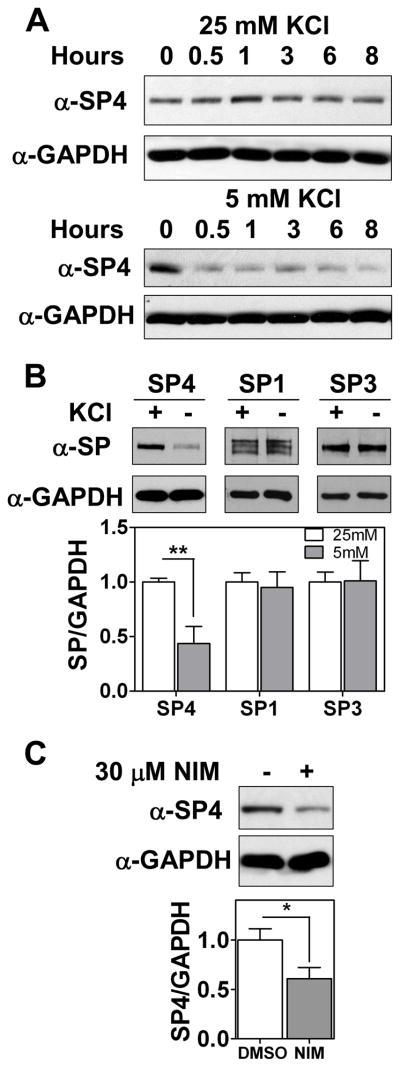
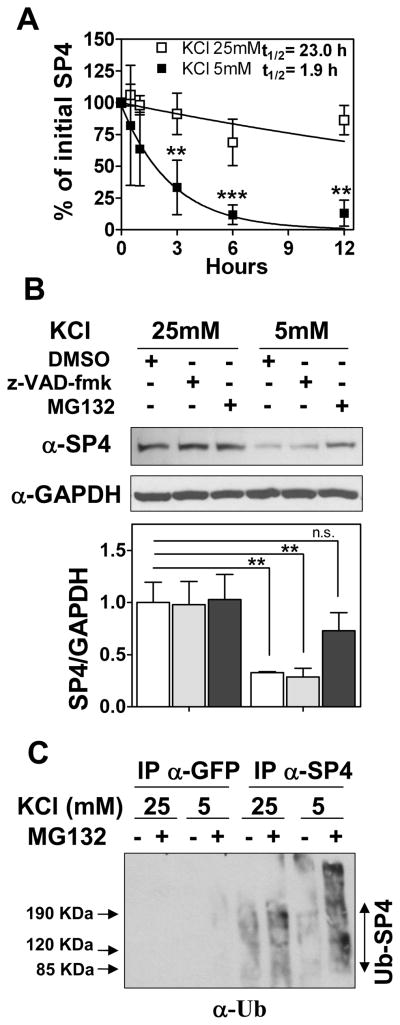
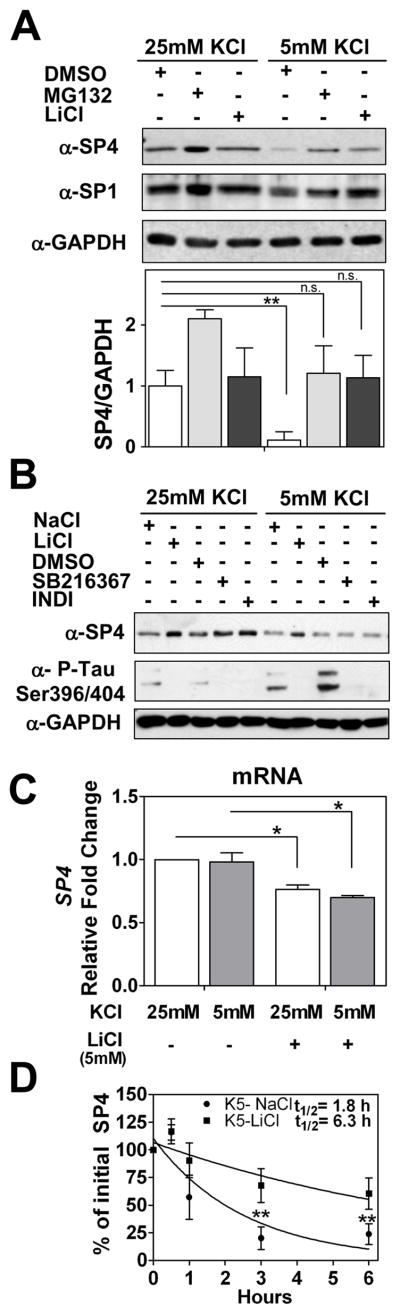
Results: We report a reduction of SP4 and SP1 proteins, but not mRNA levels, in the cerebellum of BD subjects. SP4 protein and mRNA levels were also reduced in the prefrontal cortex. Moreover, we found in rat cerebellar granule neurons that under non-depolarizing conditions SP4, but not SP1, was polyubiquitinated and degraded by the proteasome while lithium stabilized SP4 protein.

Conclusions: Our study provides the first evidence of altered SP4 protein in the cerebellum and prefrontal cortex in BD subjects supporting a possible role of transcription factor SP4 in the pathogenesis of the disease. In addition, our finding that SP4 stability is regulated by depolarization and lithium provides a pathway through which neuronal activity and lithium could control gene expression suggesting that normalization of SP4 levels could contribute to treatment of affective disorders.


Conflict of interest statement

The authors of this paper do not have any commercial associations that might pose a conflict of interest in connection with this manuscript.

Figures

Fig. 1
Fig. 1
SP4 and SP1 protein levels are reduced in postmortem cerebellum in bipolar disorder (BD) subjects. (A) Protein and mRNA levels for SP4 (top) and SP1 (bottom) in the cerebellum. Protein extracts from cerebellar postmortem tissue of healthy individuals (C, n = 10), and individuals with BD (n = 10) were immunoblotted for SP4, SP1, and glyceraldehyde-3-phosphate dehydrogenase (GAPDH). The resultant bands were quantified by densitometry. SP4 and SP1 were normalized to GAPDH values and referred to a standard sample (healthy subject). Each value represents the mean of two independent analyses. mRNA levels for SP4 and SP1 from the same subject samples were determined RT-qPCR and normalized to a reference healthy control sample and the geometric mean of three reference genes: beta glucuronidase (GUSB), TATA-binding protein (TBP), and fibroblast growth factor 1 (FGF1). Each value represents the mean of at least three independent analyses performed in duplicate. Statistical analysis was performed using Wilcoxon signed rank test for paired values (**p < 0.01). (B) Representative Western blots images for SP4, SP1, and GAPDH from four individuals (top), and representative RT-qPCR data for the same four individuals (bottom).
Fig. 2
Fig. 2
SP4, but not SP1, protein levels are reduced in postmortem prefrontal cortex from bipolar disorder (BD) subjects. (A) Protein and mRNA levels for SP4 (top) and SP1 (bottom) in the prefontal cortex. Protein extracts from prefrontal cortex postmortem tissue of healthy individuals (C, n = 10), and individuals with BD (n = 10) were immunoblotted for SP4, SP1, and glyceraldehyde-3-phosphate dehydrogenase (GAPDH). The resultant bands were quantified by densitometry and SP4 and SP1 were normalized to GAPDH values and referred to a standard sample (healthy subject). Each value represents the mean of two independent analyses. mRNA levels for SP4 and SP1 from the same subject samples were determined by RT-qPCR and normalized to a reference healthy control sample and the geometric mean of three reference genes: beta glucuronidase (GUSB), TATA-binding protein (TBP) and beta-2-microglobuline (B2M). Each value represents the mean of at least three independent analyses performed in duplicate. Statistical analysis was performed using Wilcoxon signed rank test for paired values (**p < 0.01). (B) Representative Western blot images for SP4, SP1, and GAPDH from four individuals (top), and representative RT-qPCR data for the same four individuals (bottom).
Fig. 3
Fig. 3
SP4 protein stability is regulated by depolarization. Cerebellar granule neurons were obtained from P6 rat pups and maintained in culture for 7 days in vitro (DIV-7). (A) Neurons were incubated in medium with 25 mM or 5 mM KCl in the presence of serum for the indicated times. Protein extracts were probed with antisera against SP4 and glyceraldehyde-3-phosphate dehydrogenase (GAPDH). (B) Granule neurons were incubated in medium with 25 mM or 5 mM KCl in the presence of serum for one hour. Protein extracts were resolved by SDS/electrophoresis and probed with a polyclonal antibody against Sp proteins or GAPDH as indicated. Sp protein levels were analyzed by densitometry and normalized to GAPDH levels. Values represent mean ± standard deviation. (C) At DIV-7, cerebellar granule neurons were incubated with 30 μM nimodipine or the vehicle (DMSO) for 12 hours. SP4 protein levels were analyzed by densitometry and normalized to GAPDH levels. Values represent mean ± standard deviation of three independent experiments. Statistical analysis was performed using two-tailed t-test (*p < 0.05; **p < 0.01).
Fig. 4
Fig. 4
SP4 is polyubiquitinated and degraded via the proteasome in non-depolarizing conditions. (A) Cerebellar granule neurons were incubated in media containing serum and 50 μg/ml cycloheximide and 25 mM (open symbols) or 5 mM (closed symbols) KCl. Cell lysates were prepared at the indicated times and immunoblotted with anti-SP4 antisera. Quantitation was performed by densitometry and half-life (log10 50%) of SP4 was estimated by adjusting the percentage of initial SP4 percentage values to an exponential decay curve. Values represent the mean ± standard deviation of four independent experiments. Statistical analysis was performed using ANOVA and Tukey post-hoc test (***p < 0.001; **p < 0.01). (B) Granule neurons were exposed to control vehicle (DMSO), 100 μM MG-132 (proteasome inhibitor), or 80 μM z-VAD-fmk (broad range caspase inhibitor) one hour before and after changing into a culture medium with 25 mM or 5 mM KCl in the absence of serum. After one hour of incubation, cells were lysed and protein extracts were immunoblotted with antibody against SP4 or glyceraldehyde-3-phosphate dehydrogenase (GAPDH). Values represent mean ± standard deviation of three independent experiments. Statistical analysis was performed using two-tailed t-test (**p < 0.01; n.s = not significant). (C) Granule neurons were incubated and treated with and without 10 μM MG-132 as in (B). Cell lysates were subjected to immunoprecipitation with antisera against SP4 or GFP. Immunoprecipitates were probed with an antibody against ubiquitin (α-Ub). An increase in high molecular weight species in the presence of MG132, particularly in low KCl, was also detected in anti-SP4 immunoblots (data not shown).
Fig. 5
Fig. 5
Lithium stabilized SP4 protein levels in non-depolarizing conditions through a GSK-3 independent mechanism. (A) Cerebellar granule neurons at 7 days in vitro (DIV-7) were treated with 100 μM MG132, 5 mM LiCl, or DMSO before and after switching cell medium to 25 mM or 5 mM KCl with serum. Cell lysates were analysed with antisera against SP4, SP1, and glyceraldehyde-3-phosphate dehydrogenase (GAPDH). SP4 levels were analyzed by densitometry and normalized to GAPDH levels. Values represent mean ± standard deviation of three independent experiments. Statistical analysis was performed using two-tailed t-test (**p < 0.01; n.s. = not significant). (B) Granule neurons at DIV-7 were incubated with 6 μM SB216367, 5 μM Indirubin-3′-oxime (INDI), DMSO vehicle, 5 mM NaCl or 5 mM LiCl for five hours prior to and one hour after switching cells into media containing serum and 25 mM or 5 mM KCl. Extracts were immunoblotted with antibodies against SP4, GAPDH, or the GSK-3 substrate Tau phospho Ser396/Ser404 (PHF-1). (C) Granule neurons at DIV-7 were incubated with 5 mM LiCl or 5 mM NaCl for five hours before and one hour after switching into medium containing serum and 25 or 5 mM KCl for one hour. mRNA was obtained and quantitative RT-PCR reactions for SP4 and GAPDH were performed. Data represents mean ± standard deviation of two independent reactions performed in four biological repeats. Statistical analysis was performed using one-tailed t-test (*p < 0.05; n.s. = not significant). (D) Granule neurons were incubated with 5 mM LiCl or 5 mM NaCl for five hours and then switched into medium containing serum, 50 μg/ml cycloheximide, and 25 or 5 mM KCl for the indicated times. Immunoblot analysis were performed as described for Panel A. Half-life (log10 50%) of SP4 was estimated by adjusting the logarithm of initial SP4 percentage values to a linear regression. Values represent the mean ± standard deviation of four independent experiments. Statistical analysis was performed using ANOVA and Tukey post-hoc test (**p < 0.01)

References

    1. Haldane M, Frangou S. New insights help define the pathophysiology of bipolar affective disorder: neuroimaging and neuropathology findings. Prog Neuropsychopharmacol Biol Psychiatry. 2004;28:943–960. - PubMed
    1. Savitz J, Drevets WC. Bipolar and major depressive disorder: neuroimaging the developmental-degenerative divide. Neurosci Biobehav Rev. 2009;33:699–771. - PMC - PubMed
    1. Hajek T, Carrey N, Alda M. Neuroanatomical abnormalities as risk factors for bipolar disorder. Bipolar Disord. 2005;7:393–403. - PubMed
    1. Beyer JL, Krishnan KR. Volumetric brain imaging findings in mood disorders. Bipolar Disord. 2002;4:89–104. - PubMed
    1. Bolbecker AR, Mehta C, Johannesen JK, et al. Eyeblink conditioning anomalies in bipolar disorder suggest cerebellar dysfunction. Bipolar Disord. 2009;11:19–32. - PubMed

Publication types

MeSH terms