. 2012 Feb;23(2):146-57.
doi: 10.1089/hum.2011.157. Epub 2012 Jan 26.

Enhanced athletic performance on multisite AAV-IGF1 gene transfer coincides with massive modification of the muscle proteome

Affiliations

Enhanced athletic performance on multisite AAV-IGF1 gene transfer coincides with massive modification of the muscle proteome

Antero Macedo et al. Hum Gene Ther. 2012 Feb.

Abstract

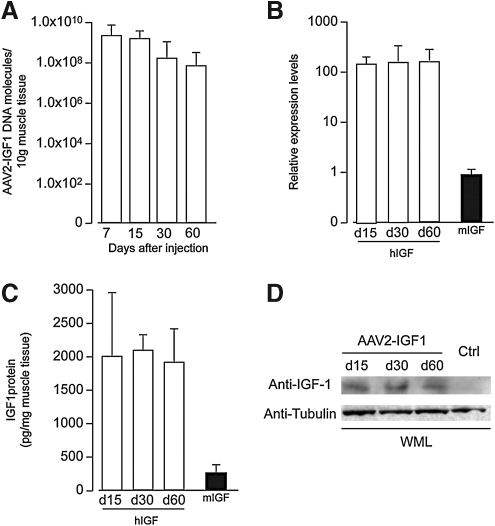
Progress in gene therapy has hinted at the potential misuse of gene transfer in sports to achieve better athletic performance, while escaping from traditional doping detection methods. Suitable animal models are therefore required in order to better define the potential effects and risks of gene doping. Here we describe a mouse model of gene doping based on adeno-associated virus (AAV)-mediated delivery of the insulin-like growth factor-I (IGF-I) cDNA to multiple muscles. This treatment determined marked muscle hypertrophy, neovascularization, and fast-to-slow fiber type transition, similar to endurance exercise. In functional terms, treated mice showed impressive endurance gain, as determined by an exhaustive swimming test. The proteomic profile of the transduced muscles at 15 and 30 days after gene delivery revealed induction of key proteins controlling energy metabolism. At the earlier time point, enzymes controlling glycogen mobilization and anaerobic glycolysis were induced, whereas they were later replaced by proteins required for aerobic metabolism, including enzymes related to the Krebs cycle and oxidative phosphorylation. These modifications coincided with the induction of several structural and contractile proteins, in agreement with the observed histological and functional changes. Collectively, these results give important insights into the biological response of muscles to continuous IGF-I expression in vivo and warn against the potential misuse of AAV-IGF1 as a doping agent.


Figures

FIG. 1.
FIG. 1.
AAV2-IGF1 efficiently transduces mouse skeletal muscle, resulting in long-lasting expression of the IGF-I protein. (A) Quantification of the number of AAV2-IGF1 DNA molecules in the injected tibialis anterior muscle at the indicated time points, as quantified by real-time PCR. (B) Real-time RT-PCR quantification of human IGF mRNA in the tibialis anterior muscle of mice injected with AAV2-IGF1 at the indicated time points. The solid column represents the quantification of endogenous IGF mRNA. Results are expressed on normalization for GAPDH mRNA. (C) ELISA assessing IGF-I protein concentration in the skeletal muscle after transduction with AAV2-IGF1. The solid column represents the concentration of murine IGF-I. (D) Representative Western blot analysis of tibialis anterior muscles transduced with AAV2-IGF1, showing constant levels of IGF-I protein expression at the indicated time points. In all panels, data are shown as means and standard deviation. WML, whole muscle lysate.
FIG. 2.
FIG. 2.
Persistent IGF-I overexpression induces skeletal muscle growth and neoangiogenesis. (A) Hematoxylin and eosin (HE)-stained sections of normoperfused muscle tibialis anterior from untreated and AAV2-IGF1-injected mice, 15 and 30 days after transduction. Long-term expression of IGF1 induced the appearance of small fibers with a central nucleus (arrows), a hallmark of an ongoing regeneration process. Scale bars: 100 μm. (B) Fiber size analysis of muscles injected with PBS or AAV2-IGF1. The histograms show the distribution of the fiber cross-sectional areas with a normal distribution curve superimposed. Data were obtained from the analysis of 20 cross-sections from 6 different animals per group. (C) Immunofluorescence staining of muscle sections of animals treated with either PBS or AAV2-IGF1, as indicated, 1 month after injection, using an antibody against the endothelial cell marker CD31. An increase in the number of CD31+ endothelial cells (green) is visible in IGF-I-expressing muscles. Nuclei were counterstained with 4′,6-diamidino-2-phenylindole (DAPI). (D) Number of capillaries in injected muscles 30 days after transduction. Data are shown as means and standard deviation of counts. Values were analyzed by setting statistical significance at p<0.01. Scale bars: 100 μm. C, control; I, IGF-I injected.
FIG. 3.
FIG. 3.
Proteomic profiling reveals profound changes in the expression levels of several proteins in IGF-I-overexpressing muscles. (A) Representative SDS–PAGE images of MyHC fiber type composition of mouse muscle proteins extracts: pooled control (Ctrl), AAV2-IGF1 after 15 days (d15), and AAV2-IGF1 after 30 days (d30). (B) Graphical representation of fiber type IIB composition (%) in the various muscle pools, as indicated. Protein band quantification was performed with ImageQuant (Molecular Dynamics/GE Healthcare) software. Data are shown as means and standard deviation; asterisks denote statistical significance (p<0.01). (C) Graphical representation of fiber type I composition (%) in the various muscle pools, as indicated. Protein band quantification was performed by Image Quant (Molecular Dynamics) software. Data are shown as means and standard deviation; asterisks denote statistical significance (p<0.01). (D) Gastrocnemius muscle protein profiling by 2D-DIGE. Typical 2-D image of gastrocnemius muscle protein extract separated in a pH 3–10 nonlinear IPG strip in the first dimension and SDS gel (12% T, 2.5% C) as the second dimension. The image was acquired with a 532-nm laser beam and 580-nm emission filter. Automated image analysis by DeCyder software detected and matched. Spots found differentially changed by in-gel differential analysis are indicated by spot number and listed in Supplementary Table S1.
FIG. 4.
FIG. 4.
Proteomic profiling of IGF-I-overexpressing muscles reveals profound changes in the levels of structural and contractile proteins. Schematic representation showing the major compartments of the sarcomere; proteins known for each compartment are listed. Numbers in parentheses refer to spot numbers, whereas arrows indicate significantly (p<0.05) up- or downregulated spots between the three experimental groups (controls and muscles overexpressing IGF-I for either 15 or 30 days).
FIG. 5.
FIG. 5.
Proteomic profiling of IGF-I-overexpressing muscles reveals profound changes in the levels of metabolic proteins. Shown is the clustering of IGF-I-regulated enzymes involved in the glycolytic pathway and in the Krebs cycle. The specific function of each enzyme is indicated in the schematic diagram of the metabolic pathways. At the side of the schematic representation of the glycolytic pathway and TCA cycle is a list of the proteins differentially expressed between the three experimental groups. Numbers in parentheses refer to the spot numbers, whereas arrows indicate significantly (p<0.05) up- or downregulated spots.
FIG. 6.
FIG. 6.
Proteomic profiling of IGF-I-overexpressing muscles reveals profound changes in the levels of proteins involved in oxidative phosphorylation. Differentially expressed proteins involved in mitochondrial respiration were classified according to their participation in the various enzyme complexes forming the oxidative phosphorylation chain. Shown is how the proton gradient is formed through the inner mitochondrial membrane, leading to ATP production. Below the schematic representation of oxidative phosphorylation is a list of the differentially expressed proteins in the three experimental groups. Numbers in parentheses refer to the spot numbers, whereas arrows indicate significantly (p<0.05) up- or downregulated spots.
FIG. 7.
FIG. 7.
Persistent IGF-I overexpression induces fast-to-slow fiber type transition. (A) Changes in the swimming time to exhaustion between controls (C) and mice that had received multiple injections of AAV2-IGF1 (I) in all four limbs. Data are shown as means and standard deviation; asterisks denote statistical significance (p<0.01). (B) Representative immunofluorescence staining of fast fibers (green) in control muscles and after injection of AAV2-IGF1. Nuclei are counterstained with DAPI. Scale bars: 100 μm. (C) Quantification of the number of fast fibers in the same experimental groups as in (B). Data are shown as means and standard deviation; asterisks denote statistical significance (p<0.01).

Comment in

Similar articles

Cited by

References

    1. Alban A. David S.O. Bjorkesten L., et al. A novel experimental design for comparative two-dimensional gel analysis: Two-dimensional difference gel electrophoresis incorporating a pooled internal standard. Proteomics. 2003;3:36–44. - PubMed
    1. Arsic N. Zentilin L. Zacchigna S., et al. Induction of functional neovascularization by combined VEGF and angiopoietin-1 gene transfer using AAV vectors. Mol. Ther. 2003;7:450–459. - PubMed
    1. Barton-Davis E.R. Shoturma D.I. Musaro A., et al. Viral mediated expression of insulin-like growth factor I blocks the aging-related loss of skeletal muscle function. Proc. Natl. Acad. Sci. U.S.A. 1998;95:15603–15607. - PMC - PubMed
    1. Benito M. Valverde A.M. Lorenzo M. IGF-I: A mitogen also involved in differentiation processes in mammalian cells. Int. J. Biochem. Cell Biol. 1996;28:499–510. - PubMed
    1. Bhasker C.R. Friedmann T. Insulin-like growth factor-1 coordinately induces the expression of fatty acid and cholesterol biosynthetic genes in murine C2C12 myoblasts. BMC Genomics. 2008;9:535. - PMC - PubMed

Publication types

MeSH terms

LinkOut - more resources