. 2011 Dec 1;115(47):13935-42.
doi: 10.1021/jp207607r. Epub 2011 Nov 7.

NMR studies of localized water and protein backbone dynamics in mechanically strained elastin

Affiliations

NMR studies of localized water and protein backbone dynamics in mechanically strained elastin

Cheng Sun et al. J Phys Chem B. .

Abstract

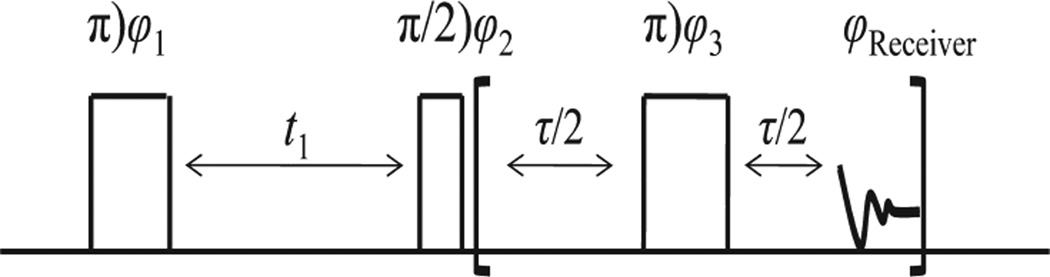
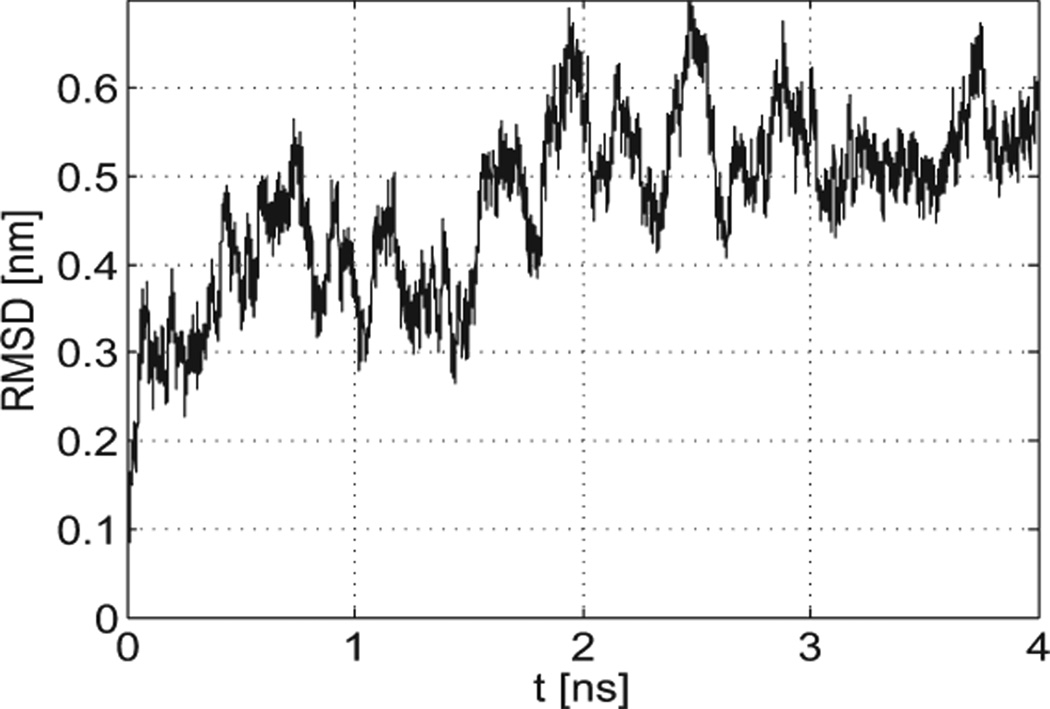
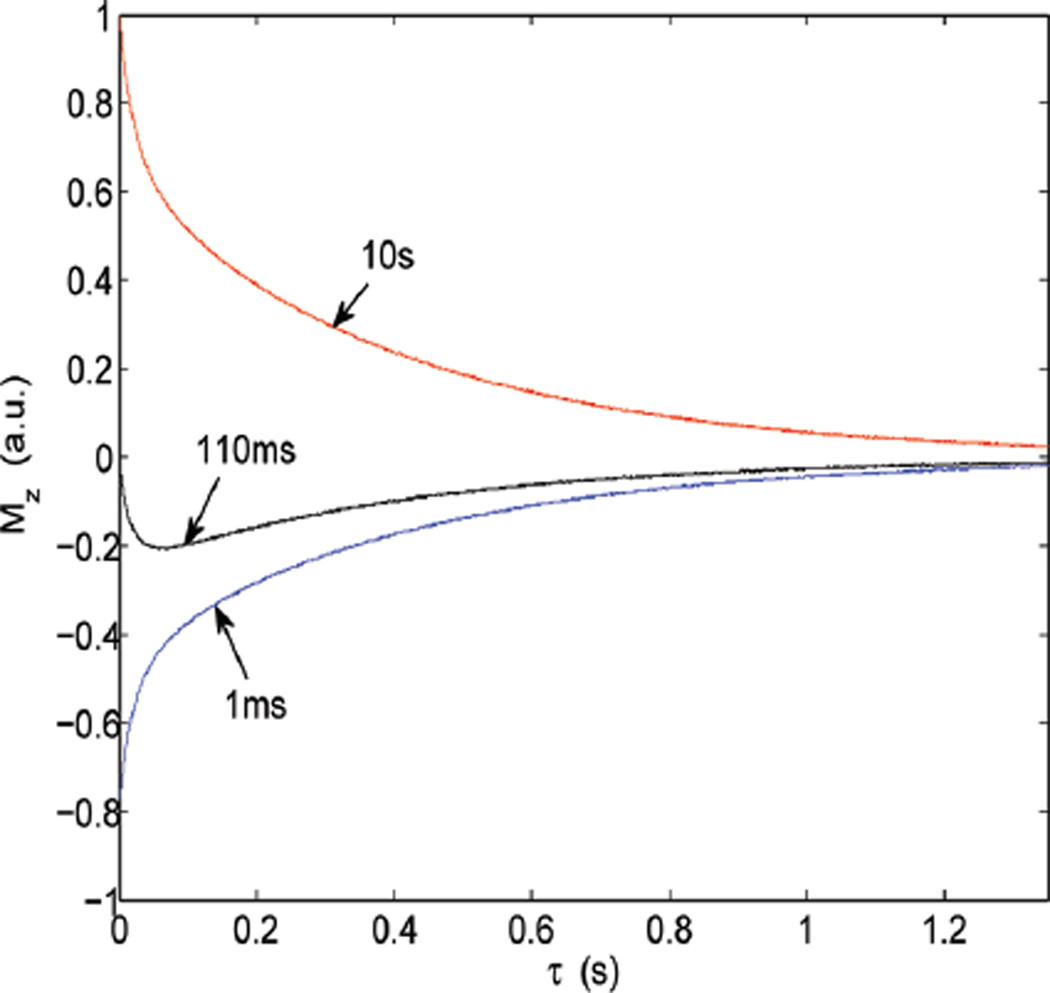
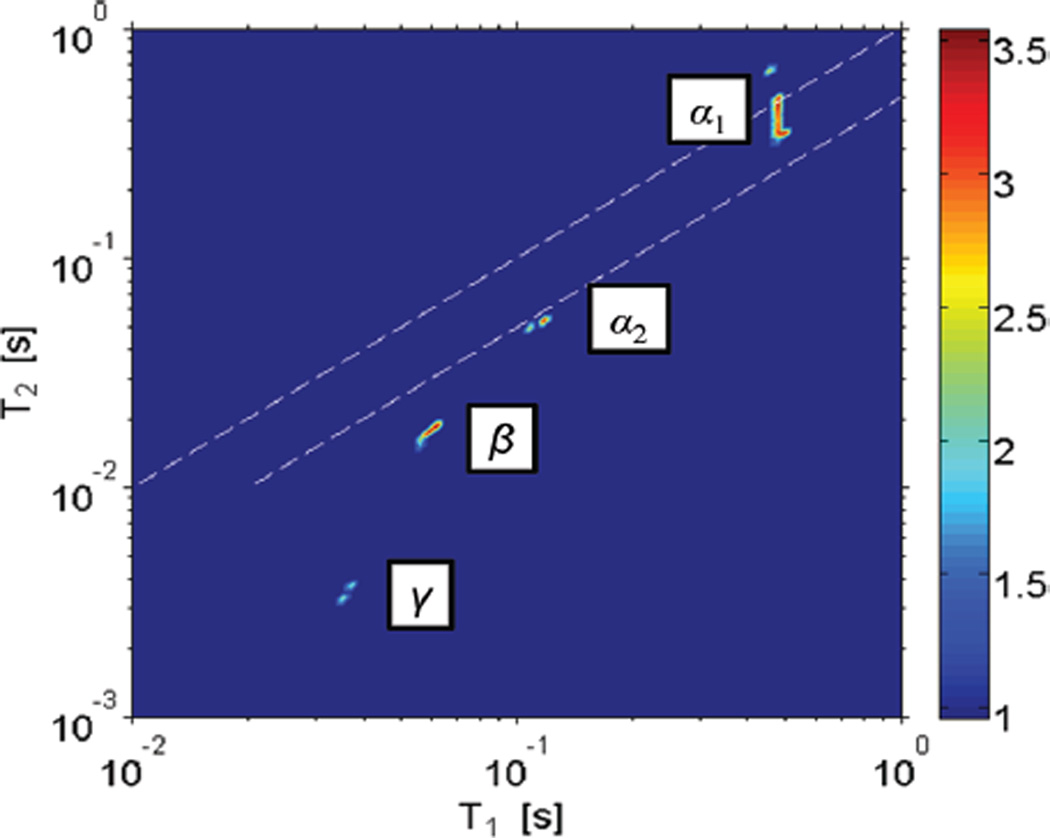
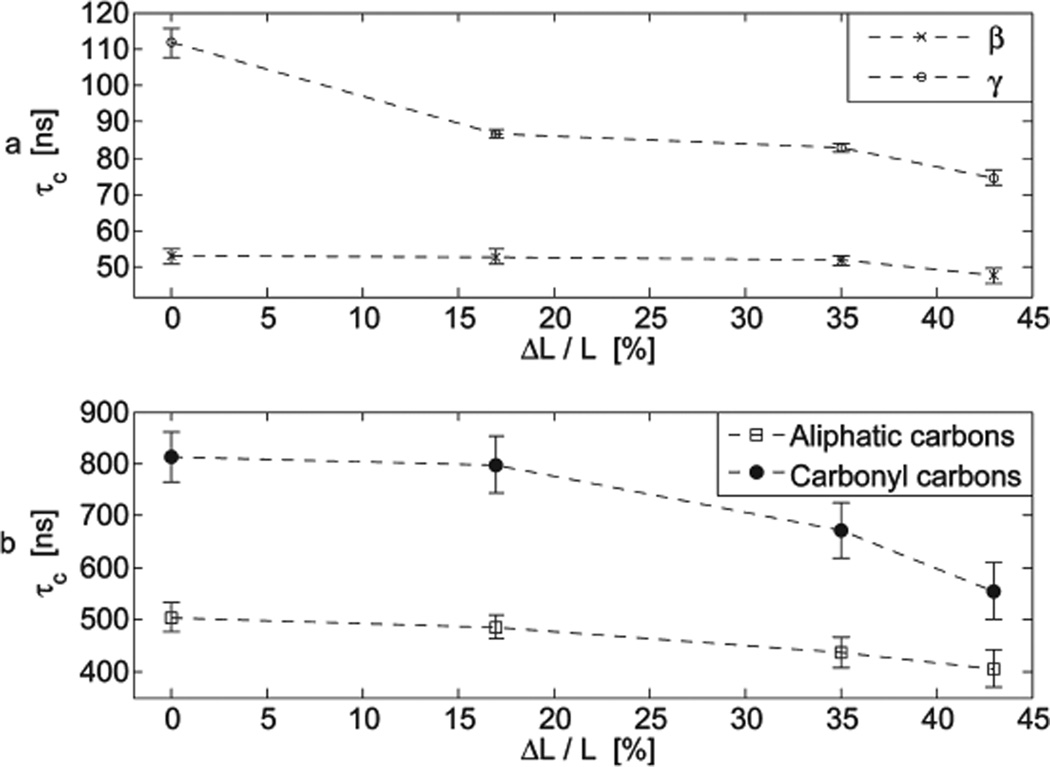
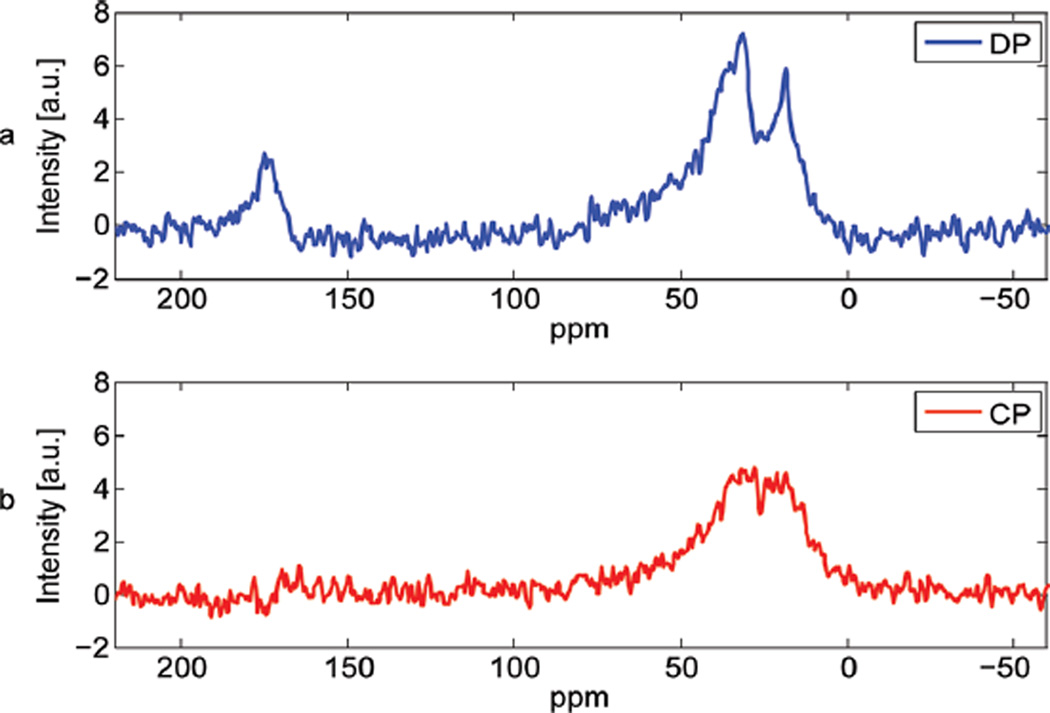
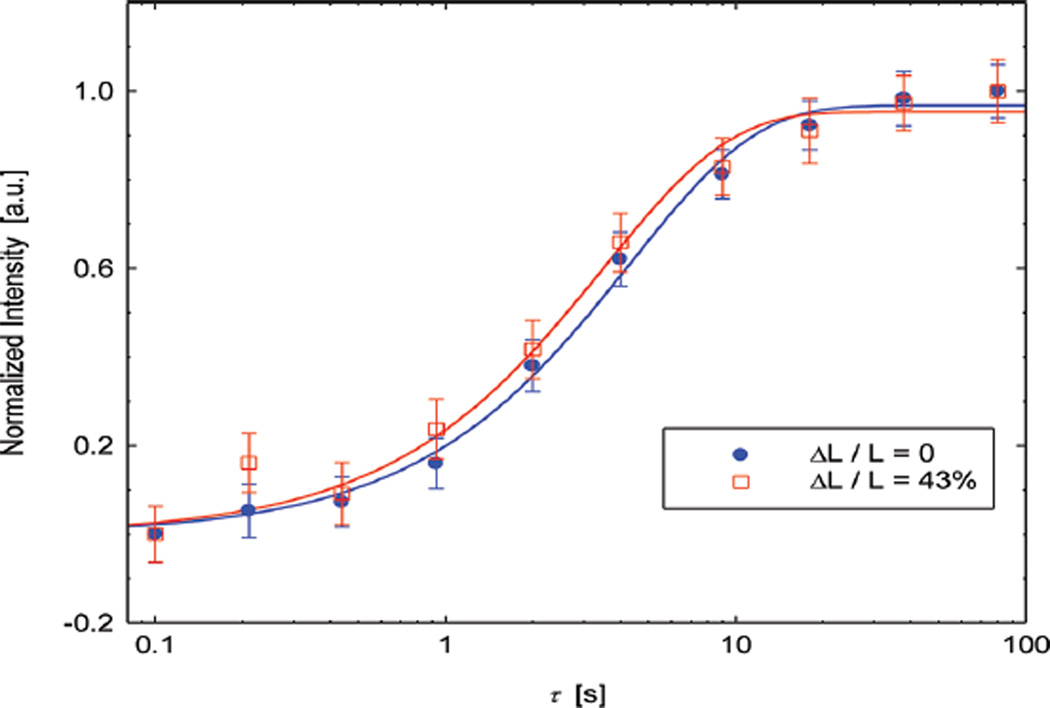
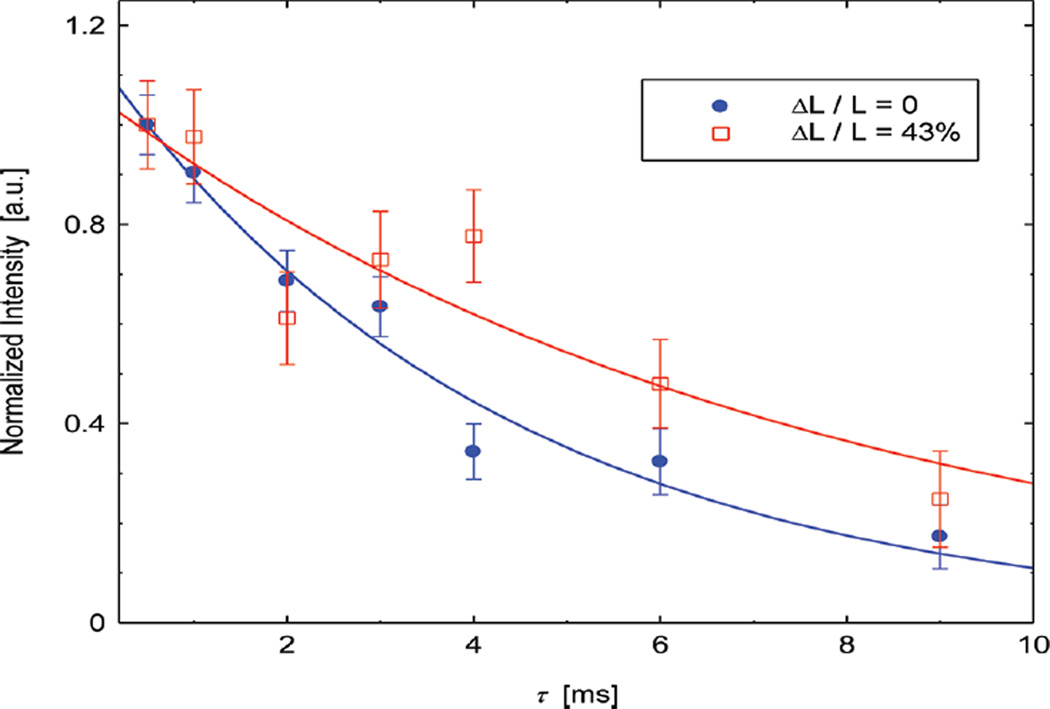
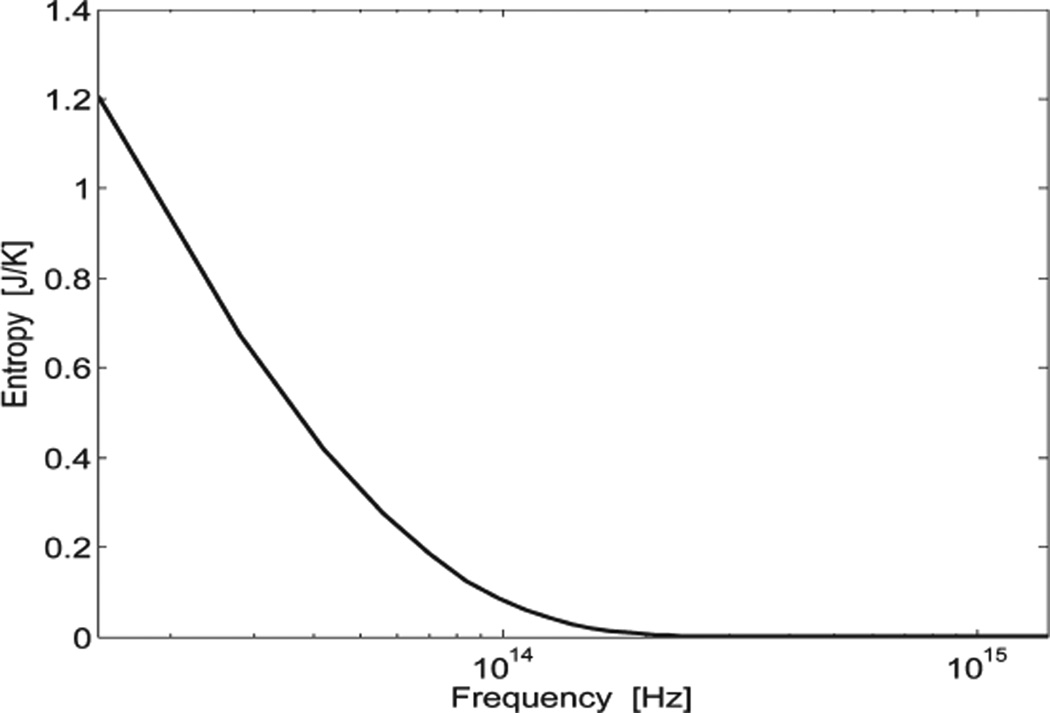
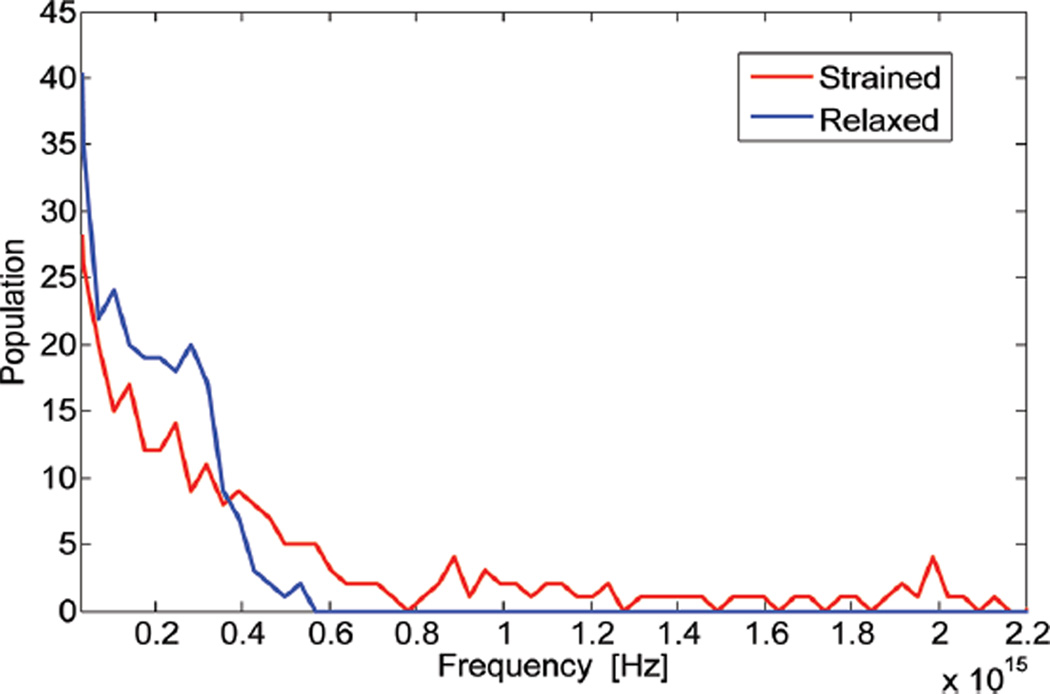
We report on measurements of the dynamics of localized waters of hydration and the protein backbone of elastin, a remarkable resilient protein found in vertebrate tissues, as a function of the applied external strain. Using deuterium 2D T(1)-T(2) NMR, we separate four reservoirs in the elastin-water system characterized by water with distinguishable mobilities. The measured correlation times corresponding to random tumbling of water localized to the protein is observed to decrease with increasing strain and is interpreted as an increase in its orientational entropy. The NMR T(1) and T(1ρ) relaxation times of the carbonyl and aliphatic carbons of the protein backbone are measured and indicate a reduction in the correlation time as the elastomer strain is increased. It is argued, and supported by MD simulation of a short model elastin peptide [VPGVG](3), that the observed changes in the backbone dynamics give rise to the development of an entropic elastomeric force that is responsible for elastins' remarkable elasticity.


Figures

Figure 1
Figure 1
NMR pulse sequence used for 2H 2D T1T2 correlation experiments in this work. In the experiments, φ1 = x, −x, φ2 = x, x, −x, −x, φ3 = y and φreceiver = x, x, −x, −x. The experimental values for t1 and τ are described in the text.
Figure 2
Figure 2
Resulting root-mean-square displacement (rmsd) averaged over all Cα atoms as a function of time in the MD simulation of the 15-residue model elastin peptide [VPGVG]3. In our analysis of the characteristics of the unstrained peptide, data from 3 to 4 ns was used. For the simulation where a force was applied, the structure after 2 ns was used as the starting structure, as described in Materials and Methods.
Figure 3
Figure 3
Sample raw data resulting from the 2H 2DT1T2 correlation experiment using the pulse sequence shown in Figure 1, on sample I. The figure shows selected slices from the 2D map for t1 = 1 ms, 110 ms, and 1s. By performing a 2D ILT of the experimental data, one obtains a correlation map that correlates T1 to T2 shown in Figure 4.
Figure 4
Figure 4
2H 2D ILT map of the T1T2NMR relaxation times of water in sample I, defined in the text. Four components are discernible and are labeled α1, α2, β, and γ. The dashed lines are used to guide the eye for the region of the 2D map where T1 is approximately equal to T2. The signal intensity, indicated by the color bar, is shown on a logarithmic scale.
Figure 5
Figure 5
Measured correlation times as a function of the applied strain. (a) Correlation times of the fluctuating quadrupolar field of D2O in close proximity to elastin (open circles for component γ and crosses for component β), as determined from eqs 1 and 2 and the measured 2H T1 and T2. (b) Correlation times characterizing the fluctuating dipolar field experienced by the carbonyl (closed circles) and aliphatic carbons (open squares) of elastin, as determined from eqs 3 and 4 and the measured 13C T1 and T. The dashed lines are used to guide the eye. The error bars shown in the graphs represent the errors propagated from the errors in the measured relaxation times.
Figure 6
Figure 6
Natural abundance 13C NMR spectra of sample I, defined in the text. (a) Direct polarization (DP) and (b) 1H → 13C cross polarization (CP). The contact time for 1H → 13C CP was 1.4 ms. The data shown were accumulated with 14512 scans, with a recycle delay of 5s. All spectra are referenced to adamantane.
Figure 7
Figure 7
Sample experimental results from the carbonyl 13C T1 measurements for the relaxed and 43% strained elastin. The solid lines shown in the figure are a best fit to a theoretical model for a saturation recovery experiment. For the relaxed sample data χ2/ν = 0.26 and χ2/ν = 0.53 for the 43% strained sample. The error bar shown in the graph represents the error in our measured signal intensity.
Figure 8
Figure 8
Sample experimental results from the carbonyl 13C T measurements for the relaxed and 43% strained elastin. The solid lines shown in the figure are a best fit to single exponential decay. For the relaxed sample data χ2/ν = 1.13 and χ2/ν = 1.65 for the 43% strained sample. The error bar shown in the graph represents the error in our measured signal intensity.
Figure 9
Figure 9
Graph of the dependence of the entropy of a harmonic oscillator, based on eq 5, as a function of frequency.
Figure 10
Figure 10
Histogram of frequencies derived from the quasi-harmonic approach in the MD simulations of the elastin mimetic peptide (VPGVG)3 under relaxed (blue line) and strained (red line) states.

Similar articles

Cited by

References

    1. Urry DW. J. Protein Chem. 1988;7:1–34. - PubMed
    1. Debelle L, Tamburro AM. Int. J. Biochem. Cell Biol. 1999;31:261–272. - PubMed
    1. Muiznieks LD, Weiss AS, Keeley FW. Biochem. Cell Biol. 2010;88:239–250. - PubMed
    1. Lillie MA, Gosline JM. J. Biorheol. 1993;30:229–242. - PubMed
    1. Partridge SM, Davies HF, Adair GS. Biochem. J. 1955;61:11–20. - PMC - PubMed

Publication types