. 2011 Oct 22:11:312.
doi: 10.1186/1471-2148-11-312.

Gene conversion and purifying selection shape nucleotide variation in gibbon L/M opsin genes

Affiliations

Gene conversion and purifying selection shape nucleotide variation in gibbon L/M opsin genes

Tomohide Hiwatashi et al. BMC Evol Biol. .

Abstract

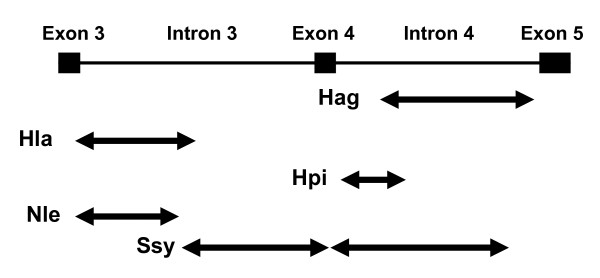
Background: Routine trichromatic color vision is a characteristic feature of catarrhines (humans, apes and Old World monkeys). This is enabled by L and M opsin genes arrayed on the X chromosome and an autosomal S opsin gene. In non-human catarrhines, genetic variation affecting the color vision phenotype is reported to be absent or rare in both L and M opsin genes, despite the suggestion that gene conversion has homogenized the two genes. However, nucleotide variation of both introns and exons among catarrhines has only been examined in detail for the L opsin gene of humans and chimpanzees. In the present study, we examined the nucleotide variation of gibbon (Catarrhini, Hylobatidae) L and M opsin genes. Specifically, we focused on the 3.6~3.9-kb region that encompasses the centrally located exon 3 through exon 5, which encode the amino acid sites functional for the spectral tuning of the genes.

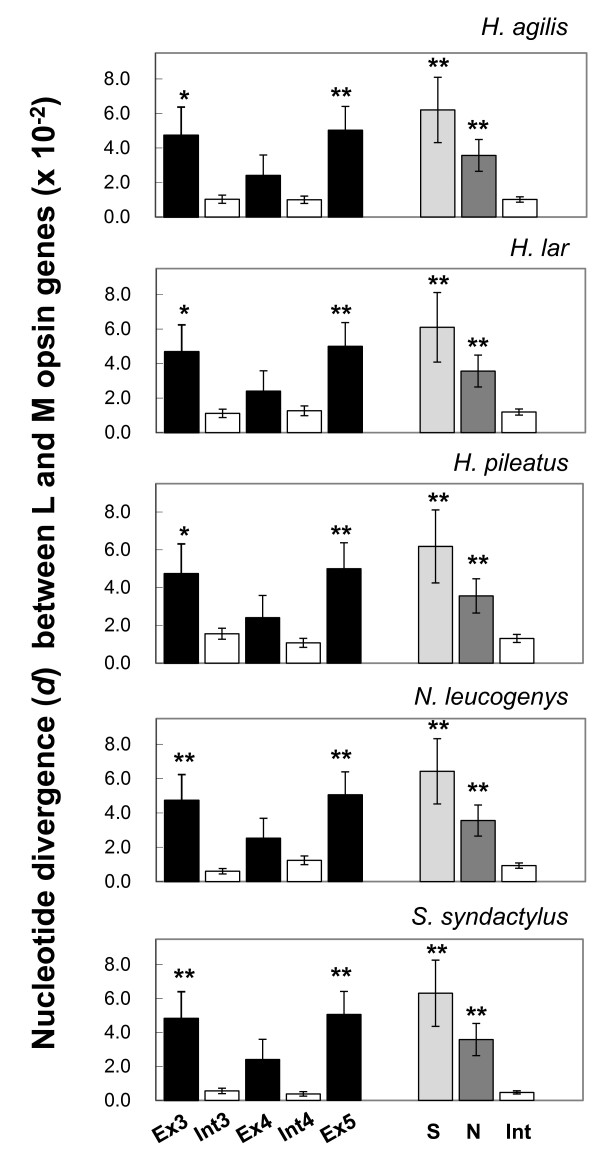
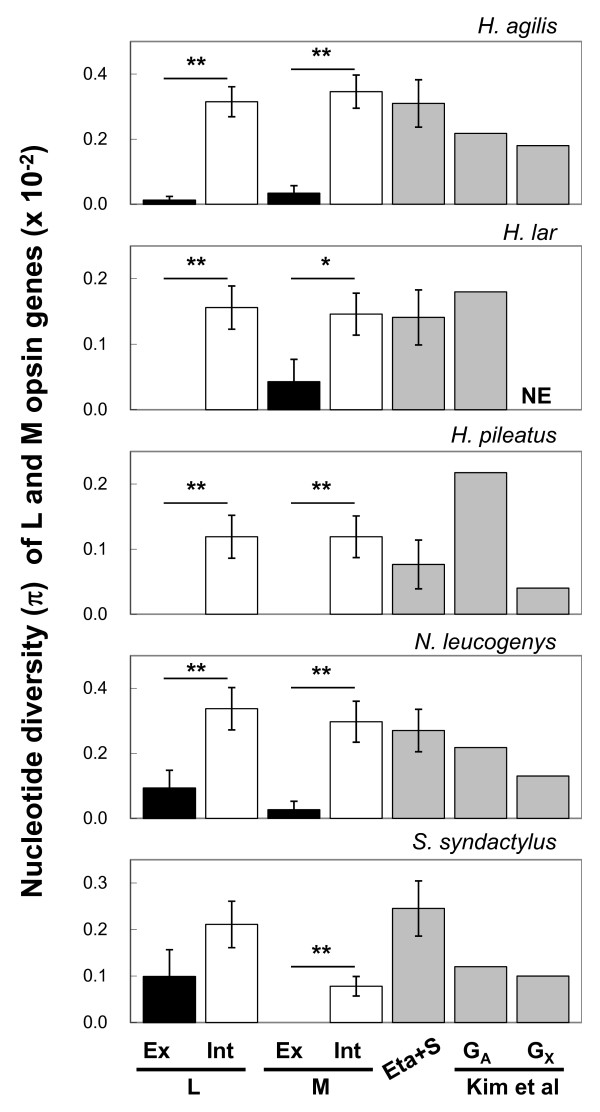
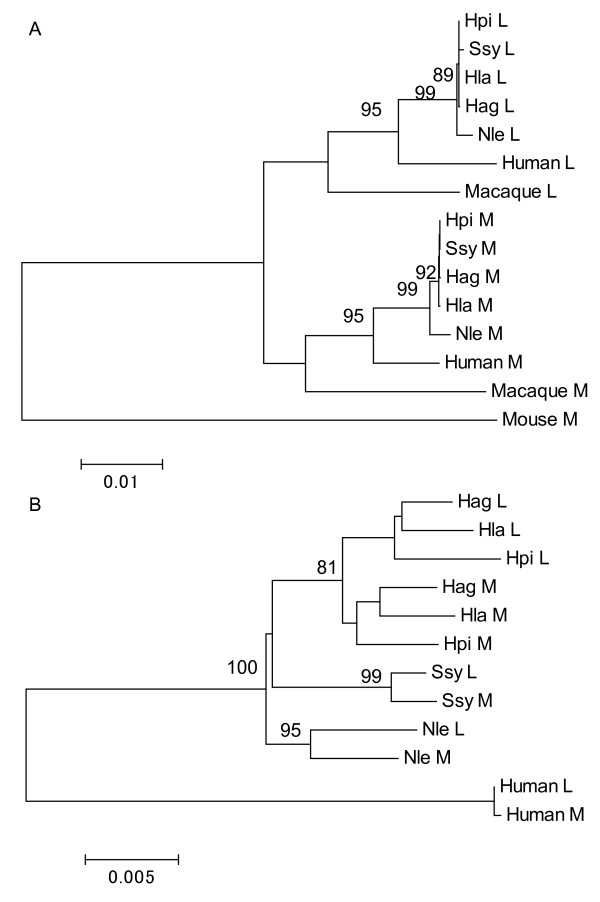
Results: Among 152 individuals representing three genera (Hylobates, Nomascus and Symphalangus), all had both L and M opsin genes and no L/M hybrid genes. Among 94 individuals subjected to the detailed DNA sequencing, the nucleotide divergence between L and M opsin genes in the exons was significantly higher than the divergence in introns in each species. The ratio of the inter-LM divergence to the intra-L/M polymorphism was significantly lower in the introns than that in synonymous sites. When we reconstructed the phylogenetic tree using the exon sequences, the L/M gene duplication was placed in the common ancestor of catarrhines, whereas when intron sequences were used, the gene duplications appeared multiple times in different species. Using the GENECONV program, we also detected that tracts of gene conversions between L and M opsin genes occurred mostly within the intron regions.

Conclusions: These results indicate the historical accumulation of gene conversions between L and M opsin genes in the introns in gibbons. Our study provides further support for the homogenizing role of gene conversion between the L and M opsin genes and for the purifying selection against such homogenization in the central exons to maintain the spectral difference between L and M opsins in non-human catarrhines.


Figures

Figure 1
Figure 1
The nucleotide divergence (d) between the L and M opsin genes in five species of gibbons, H. agilis, H. lar, H. pileatus, N. leucogenys and S. syndactylus. The d values of the exons are represented by black, the introns by white, the synonymous sites by light gray, and the non-synonymous sites by dark gray bars. The error bars indicate the estimated standard error of the d values based on the 1000 × bootstrap resampling. The asterisks indicate that the d values are significantly higher than the d value of the combined sequence of the introns 3 and 4 in each species. The single and double asterisks represent the statistical significance at 0.05 and 0.01 levels, respectively, based on the one-tailed Z test. Ex3, exon 3; Ex4, exon 4; Ex5, exon 5, Int3, intron 3; Int4, intron 4; Int, the introns 3 and 4 combined; S, synonymous sites in the exons 3, 4 and 5; N, non-synonymous sites in the exons 3, 4 and 5.
Figure 2
Figure 2
The nucleotide diversity (π) of the exons (black bar) and the introns (white bar) of the L and M opsin genes and the neutral references (gray bars) in the five species of gibbons. The gibbon genomic data reported for autosomal (GA) and X-chromosomal (GX) regions [52] are also indicated as neutral references. The π values of the combined sequences of the eta globin pseudogene and the S opsin intron 4 (Eta+S) and the π values of GA are multiplied by 3/4. The single and double asterisks represent the statistical significance at 0.05 and 0.01 levels, respectively, based on the one-tailed Z test.
Figure 3
Figure 3
The among-group phylogenetic trees of exons (A) and introns (B) of the L/M opsin genes of gibbons. (A) The combined sequences of exons 3, 4 and 5 are considered. The human L and M, the crab-eating macaque L and M, and the mouse M opsin gene sequences are included. (B) The combined intron 3 and 4 sequences are considered. The human L and M opsin gene sequences are included. Bootstrap values over 80% are indicated at the branch nodes. Scale bars indicate the number of nucleotide substitution per site. Hag, H. agilis; Hla, H. lar; Hpi, H. pileatus; Nle, N. leucogenys; Ssy, S. syndactylus.
Figure 4
Figure 4
Distribution of gene conversions between the L and M opsin genes in gibbons detected by GENECONV. The top line represents the exon-intron structure of the L/M opsin genes. The arrows represent the area covered by gene conversions detected for pairs of L and M opsin genes in the five gibbon species (see Figure 3 legend for the abbreviations of species names).

Similar articles

Cited by

References

    1. Nathans J, Thomas D, Hogness DS. Molecular genetics of human color vision: the genes encoding blue, green, and red pigments. Science. 1986;232:193–202. doi: 10.1126/science.2937147. - DOI - PubMed
    1. Jacobs GH. Primate photopigments and primate color vision. Proc Natl Acad Sci USA. 1996;93:577–581. doi: 10.1073/pnas.93.2.577. - DOI - PMC - PubMed
    1. Yokoyama R, Yokoyama S. Convergent evolution of the red- and green-like visual pigment genes in fish, Astyanax fasciatus, and human. Proc Natl Acad Sci USA. 1990;87:9315–9318. doi: 10.1073/pnas.87.23.9315. - DOI - PMC - PubMed
    1. Neitz M, Neitz J, Jacobs GH. Spectral tuning of pigments underlying red-green color vision. Science. 1991;252:971–974. doi: 10.1126/science.1903559. - DOI - PubMed
    1. Asenjo AB, Rim J, Oprian DD. Molecular determinants of human red/green color discrimination. Neuron. 1994;12:1131–1138. doi: 10.1016/0896-6273(94)90320-4. - DOI - PubMed

Publication types

LinkOut - more resources