

Review
doi: 10.1016/j.neuron.2011.09.027.
How inhibition shapes cortical activity
Affiliations
- PMID: 22017986
- PMCID: PMC3236361
- DOI: 10.1016/j.neuron.2011.09.027
Item in Clipboard
Review
How inhibition shapes cortical activity
Neuron.
.
Abstract
Cortical processing reflects the interplay of synaptic excitation and synaptic inhibition. Rapidly accumulating evidence is highlighting the crucial role of inhibition in shaping spontaneous and sensory-evoked cortical activity and thus underscores how a better knowledge of inhibitory circuits is necessary for our understanding of cortical function. We discuss current views of how inhibition regulates the function of cortical neurons and point to a number of important open questions.
Copyright © 2011 Elsevier Inc. All rights reserved.
Figures
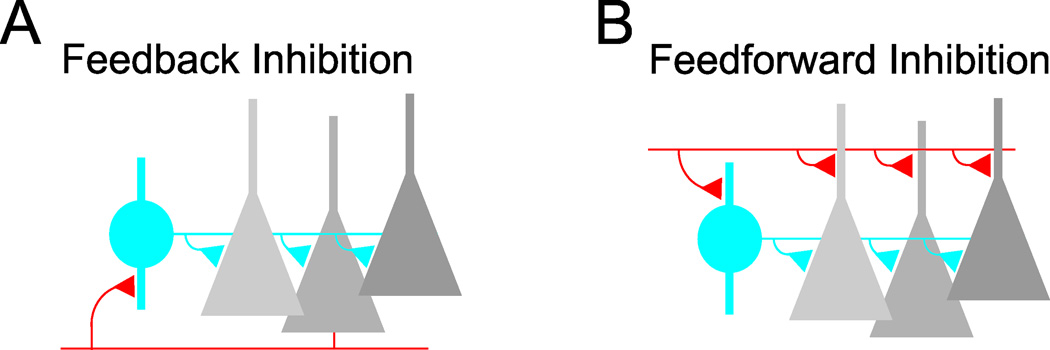
Feedback and feedfoward circuits are fundamental building blocks of cortical inhibition. A, Feedback inhibition arises when cortical principal cells (grey) make excitatory synaptic contacts (red) on local interneurons (blue) that in turn form inhibitory synaptic contacts (blue triangles) on the principal cell population. B, Feedforward inhibition is generated when long-range excitatory afferent inputs (red) diverge onto both principal cells and local interneurons.

Proportionality of excitation and inhibition during stimulus-evoked and spontaneous cortical activity. A, Intracellular recording of responses to drifting gratings of different orientations in cat visual cortex. Peristimulus time histograms of spike rate reveal the strongest increases in firing of the cortical neuron to a stimulus orientated at 90° (“preferred stimulus”). Measurements of changes in excitatory (red) and inhibitory (blue) synaptic conductance from the same recording reveal that both excitation and inhibition are tuned to the same orientation. Modified from (Anderson et al., 2000). B, Simultaneous intracellular recordings of spontaneous synaptic activity from two nearby neurons in rat somatosensory cortex. One cell (red trace) is hyperpolarized at the reversal potential for inhibition to reveal excitatory postsynaptic potentials (EPSPs) and the other (blue trace) is depolarized to reveal inhibitory postsynaptic potentials (IPSPs). Spontaneously occurring EPSPs (monitored in one cell) are accompanied by IPSPs (monitored in the neighboring cell) of co-varying amplitude. Modified from (Okun and Lampl, 2008).
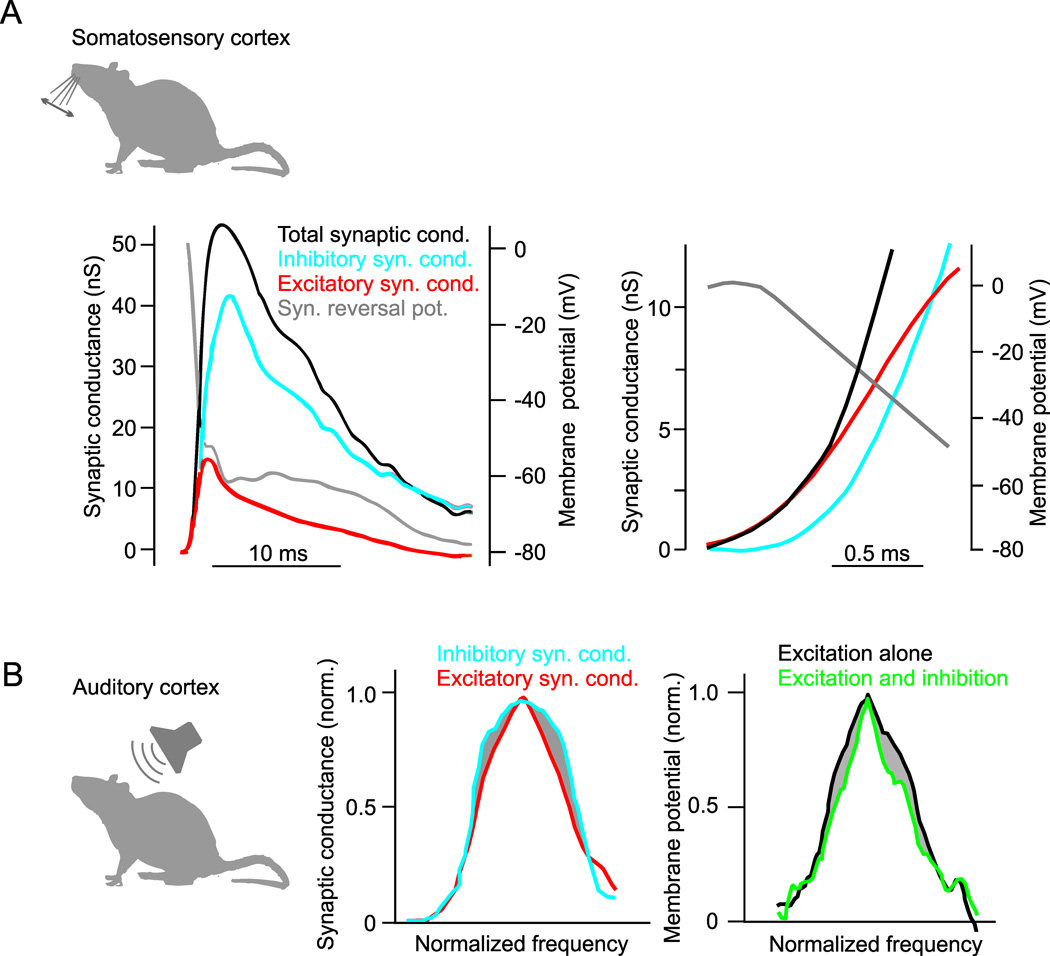
Dynamics and tuning of cortical excitation and inhibition. A, Intracellular recording of synaptic response to whisker deflection in rat somatosensory (barrel) cortex neuron. Left, Whisker deflection produces an increase in total synaptic conductance (black trace) that is composed of a rapid increase in excitatory conductance (red trace) and a delayed increase in inhibitory conductance (blue trace). The calculated reversal potential of the synaptic response (gray trace) reaches 0 mV (the reversal potential for glutamatergic excitation) immediately after the synaptic conductance begins to rise and becomes hyperpolarized (towards the reversal potential for GABA receptors) as the inhibitory conductance begins. Right, Same as left but on an expanded time-scale. Changes in reversal potential and conductances early in the response show that the onset of excitation precedes inhibition. Modified from (Higley and Contreras, 2006). B, Inhibitory sharpening of frequency tuning in rat auditory cortex. Left, Across a population of recorded cells, the average frequency tuning curve of tone-evoked inhibitory synaptic conductances (blue) is broader than the tuning curve of synaptic excitation (red). Right, Estimated membrane potential tuning curves derived from the same recordings show that inhibition causes a lateral sharpening of tone-evoked responses around the preferred stimulus frequency. Modified from (Wu et al., 2008).

Inhibition sharpens stimulus selective spike output via the “iceberg effect”. Schematic illustrates hypothetical tuning curves for firing rate (green), membrane potential (black), and excitatory conductance (red) of a cortical neuron to stimulus features (e.g. orientation). Action potential firing occurs only when membrane potential exceeds a fixed spike threshold. Responses are shown in the presence (left) and absence (right) of a weakly tuned inhibitory conductance (blue). Weakly tuned inhibition leads to more narrowly tuned spike output by allowing only the strongest (preferred) excitatory stimuli to drive the membrane potential above spike threshold.

Inhibition enforces precise spike timing. Intracellular recording of responses to a brief tone (gray box) from a principal cell in auditory cortex illustrating timing of action potentials (top), subthreshold membrane potential (middle), and the underlying excitatory and inhibitory synaptic conductances (bottom). Action potentials largely occur only in the narrow time window during which excitation precedes inhibition. Modified from (Wehr and Zador, 2003).

Cortical interneurons are more broadly tuned to sensory stimuli than principal cells. A, In vivo 2-photon calcium imaging of activity in visual cortex of transgenic mice expressing GFP in GABAergic interneurons. Cells are loaded with the calcium-sensitive dye fura-2 AM to monitor activity evoked by drifting gratings of different orientations and interneurons (Int) are distinguished from pyramidal cells (Pyr) based on expression of GFP. B, Top, Traces of calcium responses show that while GFP(−) pyramidal cells are highly selective for stimuli of particular orientations, a nearby GFP(+) interneuron is broadly responsive to all stimulus orientations. Bottom, Polar plots of visual responses to the oriented stimuli from the same cells. C, Distributions of orientation selectivity index (range 0=untuned to 1=highly selective) from a number of recordings show that responses in GFP(+) interneurons are less selective to stimulus orientation than pyramidal cells. Modified from (Sohya et al., 2007).
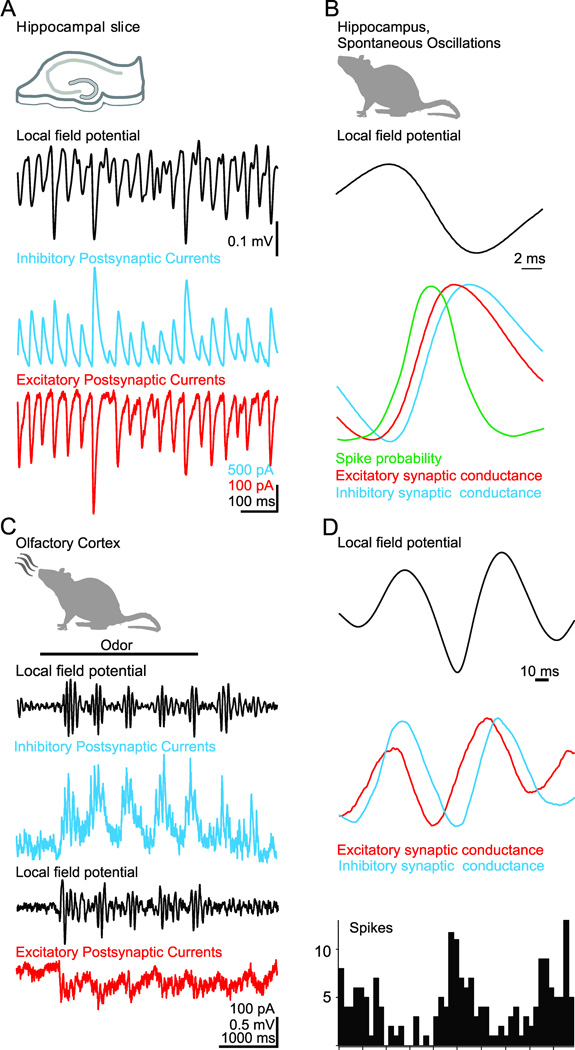
Inhibition is an essential component of synchronous oscillations in cortical activity. A, Simultaneous recording of gamma frequency (~40 Hz) oscillations in the local field potential (LFP) and the inhibitory (blue) and excitatory (red) postsynaptic currents recorded in two nearby pyramidal cells in hippocampal slices. While the amplitude of the LFP and synaptic currents varies on a cycle-to-cycle basis, the ratio of excitation to inhibition remains constant. B, In vivo recordings of spontaneous gamma oscillations in the hippocampus reveal that the phase-specific firing of action potentials (green) relative to the local field potential coincides with a brief time window during which synaptic excitation (red) precedes inhibition (blue). C, In vivo recordings from olfactory cortex reveal odor-evoked beta frequency (~20 Hz) oscillations in the local field potential and inhibitory and excitatory postsynaptic currents in a pyramidal cell. D, In olfactory cortex, phase-specific firing of action potentials (bottom histogram) relative to the local field potential (top) coincides with the brief time window during which odor-evoked synaptic excitation (red) precedes inhibition (blue). A and B modified from (Atallah and Scanziani, 2009). C and D modified from (Poo and Isaacson, 2009).
References
-
- Ali AB, Bannister AP, Thomson AM. IPSPs elicited in CA1 pyramidal cells by putative basket cells in slices of adult rat hippocampus. The European journal of neuroscience. 1999;11:1741–1753. - PubMed
-
- Anderson JS, Carandini M, Ferster D. Orientation tuning of input conductance, excitation, and inhibition in cat primary visual cortex. Journal of neurophysiology. 2000;84:909–926. - PubMed
Publication types
MeSH terms
Grants and funding
LinkOut - more resources
Full Text Sources
