. 2011 Oct 20;72(2):316-29.
doi: 10.1016/j.neuron.2011.08.032.

A putative vesicular transporter expressed in Drosophila mushroom bodies that mediates sexual behavior may define a neurotransmitter system

Affiliations

A putative vesicular transporter expressed in Drosophila mushroom bodies that mediates sexual behavior may define a neurotransmitter system

Elizabeth S Brooks et al. Neuron. .

Abstract

Vesicular transporters are required for the storage of all classical and amino acid neurotransmitters in synaptic vesicles. Some neurons lack known vesicular transporters, suggesting additional neurotransmitter systems remain unidentified. Insect mushroom bodies (MBs) are critical for several behaviors, including learning, but the neurotransmitters released by the intrinsic Kenyon cells (KCs) remain unknown. Likewise, KCs do not express a known vesicular transporter. We report the identification of a novel Drosophila gene portabella (prt) that is structurally similar to known vesicular transporters. Both larval and adult brains express PRT in the KCs of the MBs. Additional PRT cells project to the central complex and optic ganglia. prt mutation causes an olfactory learning deficit and an unusual defect in the male's position during copulation that is rescued by expression in KCs. Because prt is expressed in neurons that lack other known vesicular transporters or neurotransmitters, it may define a previously unknown neurotransmitter system responsible for sexual behavior and a component of olfactory learning.


Figures

Fig 1
Fig 1
Expression of CG10251 mRNA, protein, and subcellular localization. A) Northern blots show expression of CG10251 mRNA in heads and, to a lesser extent, in bodies. B) PCR using a panel of cDNAs from various developmental stages (see labels in panel C) confirmed high expression of CG10251/prt in adult heads, relative to the body, as well as some expression in larva, and minimal expression during pupal and embryonic stages (B, top panel). Identical samples were amplified with a probe to the widely expressed gene RP49 (B, bottom panel). Normalized levels of CG10251 expression are shown graphically in C. D, E: Expression of the CG10251 protein. D) Homogenates from wild-type S2 cells (−) and cells expressing the CG10251/prt cDNA (+) were probed on Western blots using the CG10251 antiserum. We detected a band at ~70 kD in cells expressing CG10251 but not wild-type cells. E) Homogenates from wild-type adult heads showed a similarly migrating band at ~70 kD. F, G: CG10251/PRT protein localizes to both SV and dense fractions. F) Homogenates from flies expressing an HA-tagged version of PRT were fractionated on a linear glycerol velocity gradient followed by Western blotting with primary antibodies to HA (top panel), cysteine string protein (CSP, a marker for SVs, middle panel), and late bloomer (lbm, a marker for the plasma membrane, bottom panel). For all three antibodies, the input lane (In.) and cushion (fraction 1) were processed separately to prevent over-exposure, allowing better visualization of the relevant bands. G) Homogenates from flies expressing an HA-tagged version of PRT were fractionated on a linear sucrose density gradient followed by Western blotting with primary antibodies to HA (top panel), CSP (middle panel), and the fusion protein containing Atrial Natriuretic Factor (ANF) and GFP (bottom panel, a marker for LDCVs). Molecular weight markers (kD) are shown on the left side of the figure.
Fig 2
Fig 2
Localization of PRT in the larval ventral ganglion. A–C: One to two cell bodies per hemisegment express PRT and localize to lateral aspects of the ventral nerve cord. Processes project medially into the neuropil in a complex pattern that runs throughout the ventral ganglion. Confocal images show selected optical slices though the caudal aspect of the ventral ganglion to show the labeled cell bodies (A, arrowheads) and neuropil (B, C, arrows). Scale bar: 50 μm. D–I: PRT expression in larval mushroom bodies. Larval brains expressing the membrane bound form of GFP (mCD8-GFP) with the MB driver OK107-Gal4 were labeled for PRT followed by a Cy3 conjugated secondary antibody. Confocal images show a dorsalateral view of the brain (D–F) and more ventromedial sections (G–I). GFP expression (green), PRT labeling (red) and the merged images (F, I) are shown as horizontal sections with dorsal/posterior regions at the top of each image. We detect PRT in all aspects of the MBs, including the Kenyon cells (KC), calyx (ca), the penduncle (ped), and the vertical and medial lobes (VL and ML). Scale bar: 100 μm. J–M: Expression in larval Kenyon cells, a ventromedial cluster of cells, and a large extrinsic neuron. J, K) Two optical sections show expression of PRT in the Kenyon cells (KC) of the larval MBs. Patches of unlabeled areas in the center of the KC cluster are indicated (K, asterisks). A small portion of the medial lobes (ML) and vertical lobes (VL) are visible in J. An additional group of four to five cells (J, K, arrows) at the ventral-medial aspect of each optic lobe are also labeled. L, M) Two optical sections show a large extrinsic neuron (arrowhead) sending processes to both the medial (ML) and vertical lobes (VL). The peduncle of the MB is also indicated (ped). J–M show horizontal sections with the posterior side down. Scale bars: 50 μm. See also Fig S2. N) In the frontal perspective cartoon, the KC bodies are shown as light gray circles. Processes from these cells project ventrally and rostrally to form the peduncle (ped), then branch into medial (ML) and vertically (VL) projecting lobes in the central brain. The dendrites of the KCs form the calyx (ca). A relatively large, bilaterally symmetric extrinsic neuron expressing PRT projects into each ipsilateral MB. Additional cells expressing PRT in the brain and ventral ganglia are indicated as darker gray circles, and prominently labeled processes indicated with stippling. The numbers represent arbitrary designations of cell clusters in the larva. e=esophageal foramen.
Fig 3
Fig 3
PRT expression in adult mushroom bodies, central complex and thoracic ganglion. PRT is expressed in the medial lobes β, γ (A, B), and β′ (A), the peduncle (ped, D–F) and the vertical lobes α and α′ (A–C). D–F) Optical sections through the peduncle shows expression in a subset of fibers on the lateral edge and in the center. Labeling of the KCs and calyx (E) is low intensity relative to the lobes, consistent with our expectation that a vesicular transporter localizes primarily to the axons and terminals in a mature neuron, not the cell bodies and dendrites. Additional labeled cell bodies are indicated with asterisks (A–D, F), arrowheads (A, B), and arrows (F). Arrowheads also indicate labeled projections (D–F). Scale bars: A–F, 25 μm. e = esophageal foramen, SOG = subesophageal ganglion. G–I: Projections to the central complex and medulla in the adult brain. PRT is expressed in both the fan shaped body (G, FSB) and the ellipsoid body (H, EB) of the central complex. Additional labeling (H) represents the tips of the MB medial lobes. Cell bodies at the border between the central brain and the medulla arborize in the medulla and show prominent varicosities (I, asterisks). Scale bars: G, H, 25 μm; I, 10 μm. J) The schematic shows a frontal view of the central brain that summarizes expression of PRT in the adult, including expression in the MBs and the central complex, shown in solid gray. Additional neurons and processes expressing PRT are shown as gray circles or stippling, respectively. The numbers represent arbitrary designations of cell clusters in the adult. K) Arrows indicate clusters of 2–4 labeled cell bodies in the thoracic ganglion. Anterior is up, posterior down. Scale bar: 50 μm. L, M) Higher magnification of the 3 cell clusters with the anterior cluster at the top, posterior cluster at the bottom, showing no sexual dimorphism between the male (L) and female (M). Scale bars: 10 μm.
Fig 4
Fig 4
The prt1 mutation. A) The relative position of the prt gene is shown in cytological region 95A8 on the 3rd chromosome. The shaded box at the top of the figure represents an approximately 850 bp deletion created with imprecise excision of a P-element (“P” in the inverted triangle), including the initiating methionine ( formula image
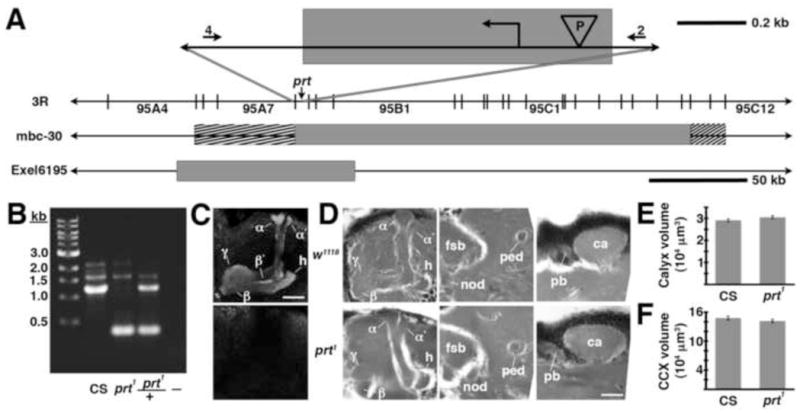
). The numbers 4 and 2 indicate primers used to detect the deletion. The lines below show deficiencies that uncover prt (Df(3R)mbc-30, Df(3R)Exel6195). The shaded boxes represent the deletion. The cross-hatched boxes indicate breakpoints approximated by polytene chromosome squash. Scale bars: 50 kb for deficiencies and 0.2 kb for inset. B) PCR was used to detect the prt1 mutation. Wild-type CS flies show a major band at 1.2 kb, prt1 flies show a major band at 400 bp, and prt1/+ heterozygotes show both. (−) indicates a no-template control. A 1 kb standard is shown on the left. C) Single confocal slices through the mushroom body lobes of whole-mount brains labeled with anti-PRT. A w1118 brain is on top with labeling of the MB lobes (α, α′, β, β′, and γ) and heel (h) and a prt1 brain is on bottom, showing no detectable anti-PRT labeling. Scale bar: 20 μm. D) H&E stained paraffin sections show that prt1 mutants have grossly intact MB morphology (α, α′, β, and γ lobes and heel (h), peduncle (ped), and calyx (ca)) and central complex (fan-shaped body (fsb), noduli (nod) and protocerebral bridge (pb)). The β′ lobe is also grossly intact in prt1 (not shown). Scale bar: 20 μm. E, F) Volumetric analyses of the MB calyx (E) and CCX (F) in CS and prt1 did not significantly differ (Student’s t-test, p = 0.1934 (E) and p = 0.2496 (F)). Bars represent means ± SEMs, n = 10 for all groups.
Fig 5
Fig 5
prt1 mutants show a learning deficit. A) prt1 mutants show normal avoidance of electric shock (90V) and the odor concentrations used for olfactory learning assays, B) octanol (10−4) and C) benzaldhyde (2 × 10⁻⁴). Bars represent means ± SEMs, n = 5 for CS in (A) and n = 6 for all other groups. D) Performance indices indicate a learning defect for prt1, seen immediately following training (0), decreased short-term memory (0.5), and reduced middle-term memory (6). * = p < 0.05, ** = p < 0.01. Statistical analyses included Student’s t-test for A-C and 2-way ANOVA with Bonferroni’s post test for D. 2-way ANOVA reveals no significant interaction of time and genotype (p = 0.3976) suggesting normal memory decay in prt1. Symbols represent means ± SEMs, n = 12 for learning, n = 6 for memory.
Fig 6
Fig 6
prt1 reproductive behavior. A) prt1 mutant males spent 26% less time courting (*, p = 0.0182). B) The top two panels show normal copulatory positions seen in wild-type flies while the bottom two panels show improper positioning exemplary of prt1. C) prt1 mutants struggle throughout copulation. Quantification of the time a male spends out of position during copulation revealed a significant difference between CS and prt1 (first two bars, p < 0.001). Inter-genotype pairings suggest the prt1 male was responsible for this phenotype (last two bars, p < 0.01). D) Two different deficiencies uncovered prt. Both prt1/Df(3R)mbc-30 and prt1/Df(3R)Exel6195 phenocopied the copulation behavior seen in prt1 (last two columns, p < 0.05 and 0.001, respectively). E) prt1 mutants were fertile but had reduced fecundity (# progeny/mating pair), 53% that of CS (*, p = 0.0167). * = p < 0.05, ** = p < 0.01, *** = p < 0.001. Statistical analyses included Student’s t-test for A & E and ANOVA with Bonferroni’s post test for multiple comparisons for all other assays. Bars represent means ± SEMs. The n for each group is shown with each column. See also Movies S1 and S2, and Fig S3.
Fig 7
Fig 7
Genetic rescue of copulation defect (see legends on right for genotypes). A) The combination of the Da-Gal4 driver with a UAS-prt transgene rescued the copulation phenotype (columns 6 & 7, p < 0.01 and 0.05, respectively); driver or UAS-prt transgene alone did not (columns 3–5). B) prt1 mutants had significantly shorter copulation duration (columns 1 & 2, p < 0.001), rescued with Da-Gal4 plus UAS-prt transgenes (columns 6 & 7, p < 0.001 for both) but not driver or UAS-prt alone (columns 3–5). C) PRT transgenic expression with a MB driver (OK107-Gal4) rescued the prt1 copulation phenotype (columns 13 & 14, p < 0.05 and 0.001, respectively); driver or UAS-prt transgenes alone did not (columns 10–12). D) The short duration phenotype was similarly rescued using OK107-Gal4 plus UAS-prt transgenes (columns 13 & 14, p < 0.01 and 0.001, respectively). The UAS-prt transgene on the 2nd rescued in the absence of driver, presumably due to leaky PRT expression (column 12, p < 0.05 compared to prt1). * = p < 0.05, ** = p < 0.01, *** = p < 0.001, ANOVA with Bonferroni’s post test for multiple comparisons. Bars represent means ± SEMs. The n for each group is shown with each column.
Fig 8
Fig 8
Point mutants of conserved aspartates fail to rescue copulation defect. Transgenic expression with a ubiquitous driver (Da-Gal4) rescued the prt1 copulation phenotype with wild-type PRT (8th column, p < 0.001) but not with the D59A (9th column) or D483A mutations (10th column). In contrast, transgenic expression of the Q521A mutation did rescue the prt1 copulation phenotype (final column, p < 0.05). The driver or UAS-prt transgenes alone did not rescue the behavior (columns 3–7, p > 0.05 for all compared to prt1). * = p < 0.05, ** = p < 0.01, *** = p < 0.001, ANOVA with Bonferroni’s post test for multiple comparisons. Bars represent means ± SEMs. The n for each group is shown with each column. NS: not significant.

References

    1. Acebes A, Cobb M, Ferveur JF. Species-specific effects of single sensillum ablation on mating position in Drosophila. J Exp Biol. 2003;206:3095–3100. - PubMed
    1. Ackerman SL, Siegel RW. Chemically reinforced conditioned courtship in Drosophila: responses of wild-type and the dunce, amnesiac and don giovanni mutants. J Neurogenet. 1986;3:111–123. - PubMed
    1. Ahuja A, Singh RS. Variation and evolution of male sex combs in Drosophila: nature of selection response and theories of genetic variation for sexual traits. Genetics. 2008;179:503–509. - PMC - PubMed
    1. Baier A, Wittek B, Brembs B. Drosophila as a new model organism for the neurobiology of aggression? J Exp Biol. 2002;205:1233–1240. - PubMed
    1. Bao X, Wang B, Zhang J, Yan T, Yang W, Jiao F, Liu J, Wang S. Localization of serotonin/tryptophan-hydroxylase-immunoreactive cells in the brain and suboesophageal ganglion of Drosophila melanogaster. Cell Tissue Res. 2010;340:51–59. - PubMed

Publication types

MeSH terms

Substances