. 2011 Oct 20;72(2):330-43.
doi: 10.1016/j.neuron.2011.07.010.

A cortical substrate for memory-guided orienting in the rat

Affiliations

A cortical substrate for memory-guided orienting in the rat

Jeffrey C Erlich et al. Neuron. .

Abstract

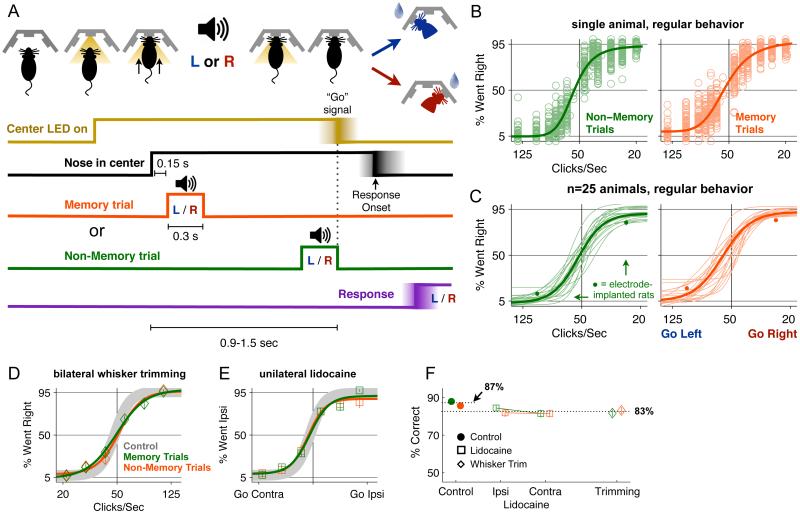
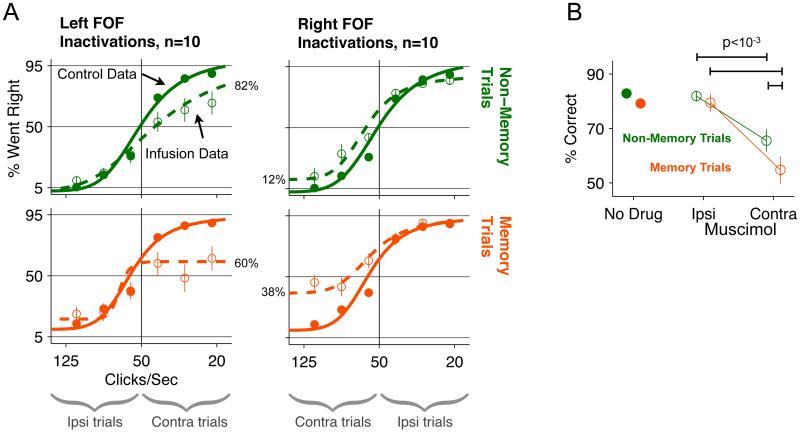
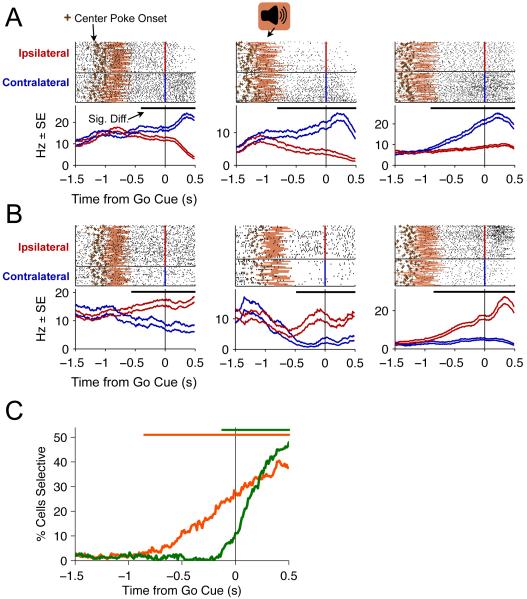
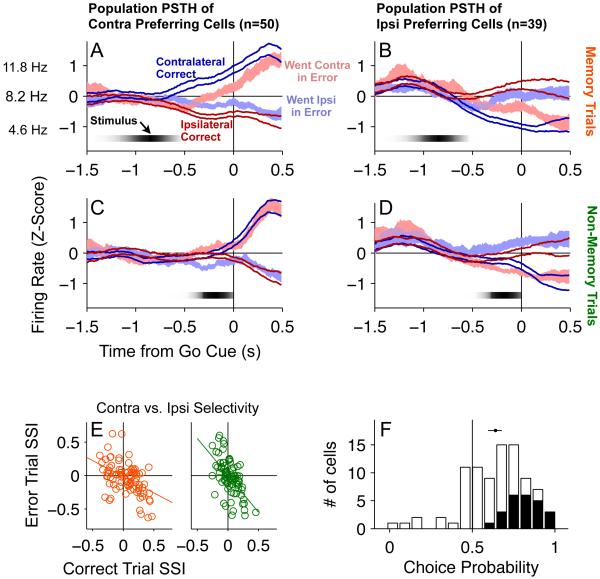
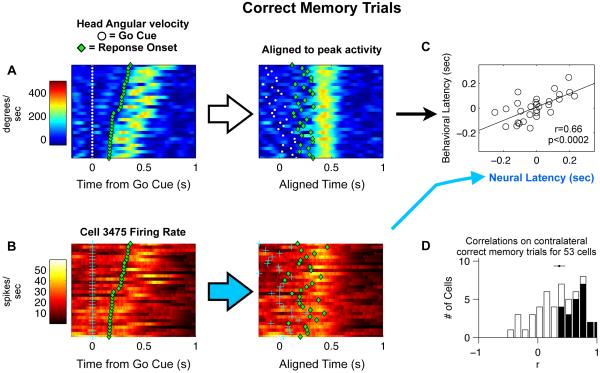
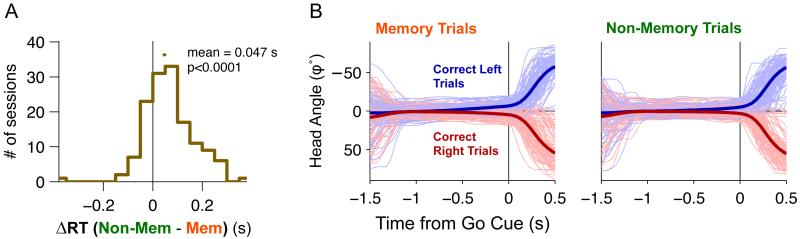
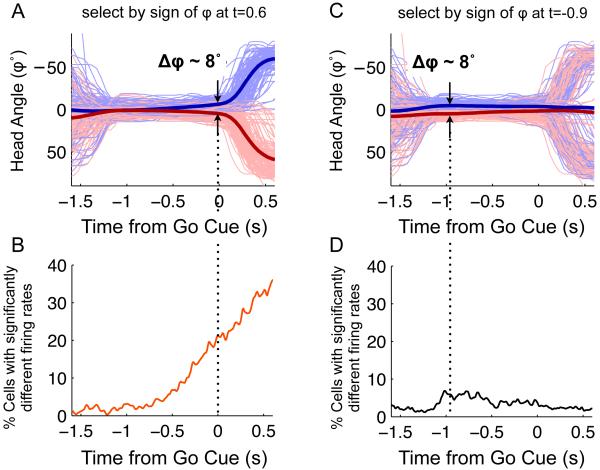
Anatomical, stimulation, and lesion data have suggested a homology between the rat frontal orienting fields (FOF) (centered at +2 AP, ±1.3 ML mm from Bregma) and primate frontal cortices such as the frontal or supplementary eye fields. We investigated the functional role of the FOF using rats trained to perform a memory-guided orienting task, in which there was a delay period between the end of a sensory stimulus instructing orienting direction and the time of the allowed motor response. Unilateral inactivation of the FOF resulted in impaired contralateral responses. Extracellular recordings of single units revealed that 37% of FOF neurons had delay period firing rates that predicted the direction of the rats' later orienting motion. Our data provide the first electrophysiological and pharmacological evidence supporting the existence in the rat, as in the primate, of a frontal cortical area involved in the preparation and/or planning of orienting responses.


Figures

Figure 1
Figure 1. Memory-guided Frequency Discrimination Task and Behavioral Performance
(A) Task schematic, showing a cartoon of a rat in the behavior box and the timing of the events in the task. Onset of the Center LED indicated to the rat it should put its nose in the center port, and remain there until the LED was turned off. During this variable-duration “nose fixation” or “nose-in-center” period, a 300 ms-long periodic train of auditory clicks was played. Click rates higher than 50 clicks/sec indicated that a water reward would be available from the left port; click rates lower than 50 clicks/sec indicated reward would be available from the right port. On memory trials (orange), the click train was played near the beginning of the fixation period, and there was a several hundred ms delay between the end of the click train and the end of the nose fixation signal. On non-memory trials (green) the click train ended at the same time as the nose fixation signal. (B) An example of performance data for a single rat. Each circle indicates the percentage of trials in which the subject chose the right port for a given stimulus in a single session. There were 6 stimuli presented in each session. The thick line shows the psychometric curve, drawn as a 4-parameter sigmoidal fit to the circles. The left panel shows data from non-memory trials, and the right panel shows data from memory trials. (C) Psychometric curves showing performance of 20 rats. Thin lines are the fits to individual rats, as in panel B. Thick lines are the fits to the data combined across rats. The performance of electrode implanted rats (n=5) is shown by the small filled circles at the two stimuli used with these animals (25 clicks/sec and 100 clicks/sec). (D) Bilateral whisker trimming (3 rats) has a minimal effect on performance. The grey line is the average of memory and non-memory trials for control sessions before whisker trimming. Diamonds are data after trimming, solid lines are sigmoid fits. Memory trials are in orange, non-memory trials in green. (E) Unilateral whisker pad anesthesia and paralysis (4 rats) also has a minimal effect on performance. Open circles are data from lidocaine sessions. Color conventions as in panel D. (F) Summary of effects of whisker trimming and lidocaine (See also Figure S1, Movies S1-3).
Figure 2
Figure 2. Unilateral inactivation of FOF generates a contralateral impairment that is larger for memory trials compared to non-memory trials
(A) Behavioral performance on control and muscimol-infusion days. Top row: non-memory trials. Bottom row: memory trials. Left column: muscimol infusions into left FOF. Right column: music-mol infusions into right FOF. Open circles, data from muscimol infusions. Closed circles: control data from days immediately preceding infusion days. Dashed lines: sigmoidal fits to muscimol data. Solid Lines: sigmoidal fits to control data. Error bars are standard error of the mean. Error bars for control data were smaller than the marker in most cases. Underbraces at bottom indicate the sets of trials in which animals were instructed to orient ipsilaterally or contralaterally to the site of infusion. The percentages aligned to the dashed curves indicate the endpoint performance for the trials contralateral to the infusion. (B) Combined data from left and right infusion sessions and collapsed across all stimulus difficulty levels. The “No Drug” data come from the 20 sessions one day before infusion sessions. The Ipsi and Contra Muscimol data are the performance on ipsilateral trials and contralateral trials on infusion sessions (n=20). (See also Figure S2)
Figure 3
Figure 3. Upcoming choice-dependent delay period activity in the FOF
(A) Three contralateral preferring cells and (B) three ipsilateral preferring cells that show delay period activity that is dependent on the upcoming side choice. The top half of each panel shows spike rasters sorted by the side of the rat’s response and aligned to the time of the Go cue. The pink shading indicates the time, for each trial, when the stimulus was on. The brown “+’ indicates the time at which the rat placed its nose in the center port. The bottom half of each panel are PETHs of the rasters for ipsilateral (red) and contralateral (blue) trials. The two lines are indicate the mean ± std. err. PETHs were generated using a causal half-gaussian kernel with an S.D. of 200 ms. The thick black bar just below the rasters indicates the times when the cells response was significantly different on ipsi-vs contralateral trials (p<0.01, ROC analysis). (C) Development of choice-dependent activity over the course of the trial. The lines indicate the % of cells (out of 242 neurons) that have significantly choice-dependent firing rate (p<0.01) at each timepoint on memory trials (orange) and non-memory trials (green). (See Figure S3A,B for inter-spike interval histograms and waveforms for the example neurons)
Figure 4
Figure 4. Predictive coding of contra- and ipsilateral choice in the FOF
(A-D) Each panel is a population PETH showing the average z-score normalized response on correct (thick lines, mean±s.e. across neurons) and error trials (shaded, mean±s.e. across neurons) where the correct response was contralateral (blue) or ipsilateral (red) to the recorded neuron. PETHs are aligned to the time of the ‘Go’ signal (center LED offset). (A) The average responses of memory trials for 53 contra-preferring neurons. Vertical axis tick marks indicate z-score value. The average firing rate across all cells used for z-score normalization is shown next to the z=0 mark (8.2 spikes/sec). This overall mean ± the across-cell average of the PETH standard deviation are shown at the z= ± 1 marks. They indicate a typical firing rate modulation of 7.2 spikes/sec. (B) The average responses of memory trials of 43 ipsi-preferring neurons. (C) Same as A but for non-memory trials. (D) Same as B but for non-memory trials. (E) Cells encode the direction of the motor response, not the identity of the cue stimulus. Scatter plots of the Side-Selectivity Index for memory trials (orange) and non-memory trials (green) (n=89). (F) Histogram of the choice probability of neurons for trials where the rat was instructed to go in the cells’ preferred direction (n=89). The dot and line indicate the mean ± 95% c.i. of the mean. Black bars indicate individually significant neurons. White bars indicate neurons that were not individually significant.
Figure 5
Figure 5. Trial-by-trial correlation of neural and behavioral latency
(A) Head angular velocity data from left correct memory trials in a single session. Each row is a single trial, showing head angular velocity (color-coded) as a function of time. The white dots indicate the time of the Go cue, and the green dots indicate the Response Onset time. Left panel: Trials are sorted by reaction time (Response Onset - Go cue). Right panel: same trials, after each trial has been time-shifted to maximize the similarity between the trial’s angular velocity profile and the average of all the other trials. (B) Same trials as in panel A, but color code here indicates firing rate of a single neuron. Left panel is before alignment. Right panel is after time-alignment to maximize the similarity between each trial’s firing rate profile and the average of all the other trials. (C) Correlation between the angular velocity time offsets and the neural firing rate time offsets computed in A&B. (D) Histogram of r values for 53 cells with significant delay period activity that were recorded during sessions where head-tracking was also recorded. Black bars indicate individual cells with correlations significantly greater than zero. The dot with the line through it shows the mean±s.e. of r values for the population. (See also Figure S5)
Figure 6
Figure 6. Rats plan their response during the delay period on memory trials
(A) Movement times (MT) are faster for memory trials than non-memory trials. Movement times are measured as median Response time - Response Onset time for each physiology session. The mean difference between memory and non-memory trials is 47 ms (t-test,t141=3.58, p<10−5 from the 5 electrode implanted rats). The dot above the histogram indicates the mean ± s.e. of the distribution. (B) Average head-angle data from 84 recording sessions. Thin lines are 200 example trials randomly sub-sampled from all 84 sessions. The thick lines are the average across all trials across all sessions. In our coordinate system, φ = zero degrees points directly towards the center port, positive φ corresponds to rightward orientations, and negative φ to left-ward orientations. On memory trials one can observe a subtle but clear change in the head angle in the direction of the response during the delay period, starting around 500 ms before the end of the fixation period. (See also Figure S6 for head-direction related neural activity)
Figure 7
Figure 7. Predictive coding of response is not a simple function of current head angle
A, C Plots of head angle as a function of time relative to the Go signal for memory trials. Thin blue lines are from a random subsample of trials where the head angle was greater that 0 (oriented leftwards from center port) at the time indicted by the vertical dotted line; thin red lines are from a random subsample of trials where the head angle was less than 0 at the indicated time: t=+0.6 sec for A and t=−0.9 sec for C, relative to the Go signal. Thick lines are the mean head angles for each group, averaged over all correct memory trials. B, ROC plot (similar to 5b) for the trial grouping defined in A. D, ROC plot for the trial grouping defined in C. (See Figure S7 for similar analyses using angular velocity and acceleration).

Comment in

References

    1. Arbib MA. From visual affordances in monkey parietal cortex to hippocampo-parietal interactions underlying rat navigation. Philos Trans R Soc Lond B Biol Sci. 1997;352:1429–1436. - PMC - PubMed
    1. Bisley JW, Goldberg ME. Attention, intention, and priority in the parietal lobe. Annu Rev Neurosci. 2010;33:1–21. - PMC - PubMed
    1. Brecht M, Krauss A, Muhammad S, Sinai-Esfahani L, Bellanca S, Margrie TW. Organization of rat vibrissa motor cortex and adjacent areas according to cytoarchitectonics, microstimulation, and intracellular stimulation of identified cells. J Comp Neurol. 2004;479:360–373. - PubMed
    1. Britten KH, Newsome WT, Shadlen MN, Celebrini S, Movshon JA. A relationship between behavioral choice and the visual responses of neurons in macaque MT. Vis Neurosci. 1996;13:87–100. - PubMed
    1. Bruce CJ, Goldberg ME. Primate frontal eye fields. I. Single neurons discharging before saccades. J Neurophysiol. 1985;53:603–635. - PubMed

Publication types