. 2011 Oct 20;72(2):344-56.
doi: 10.1016/j.neuron.2011.09.020.

Primary motor cortex reports efferent control of vibrissa motion on multiple timescales

Affiliations

Primary motor cortex reports efferent control of vibrissa motion on multiple timescales

Daniel N Hill et al. Neuron. .

Abstract

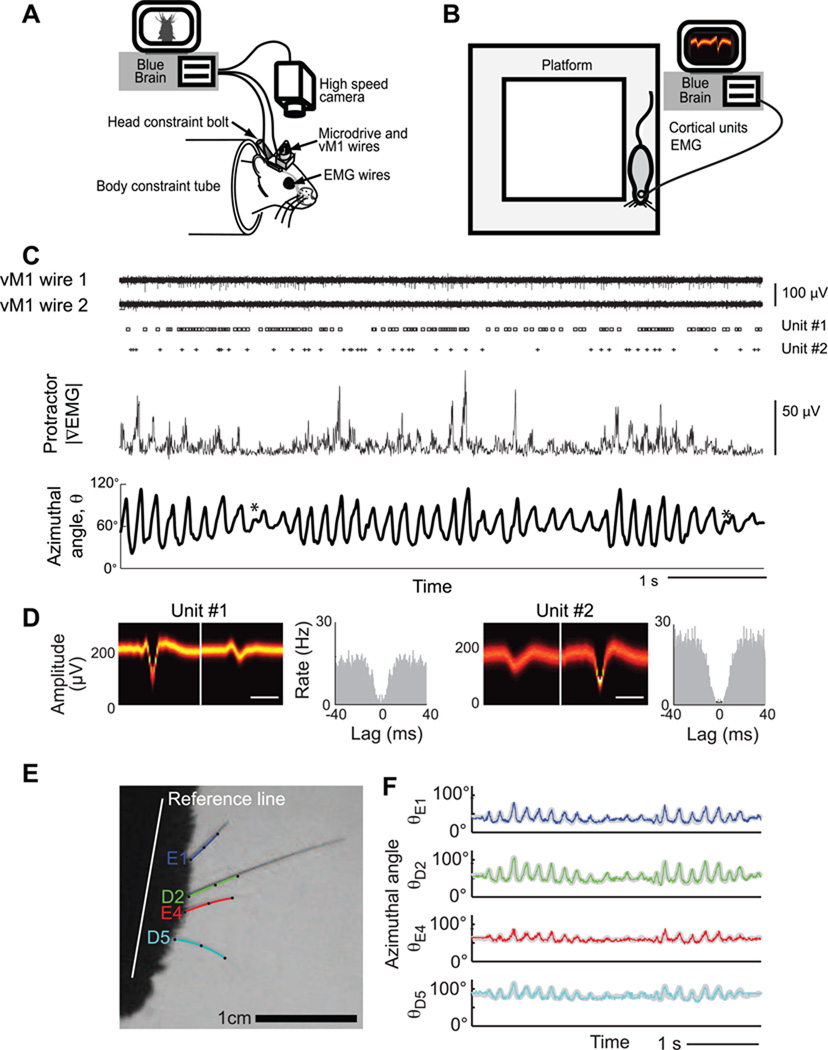
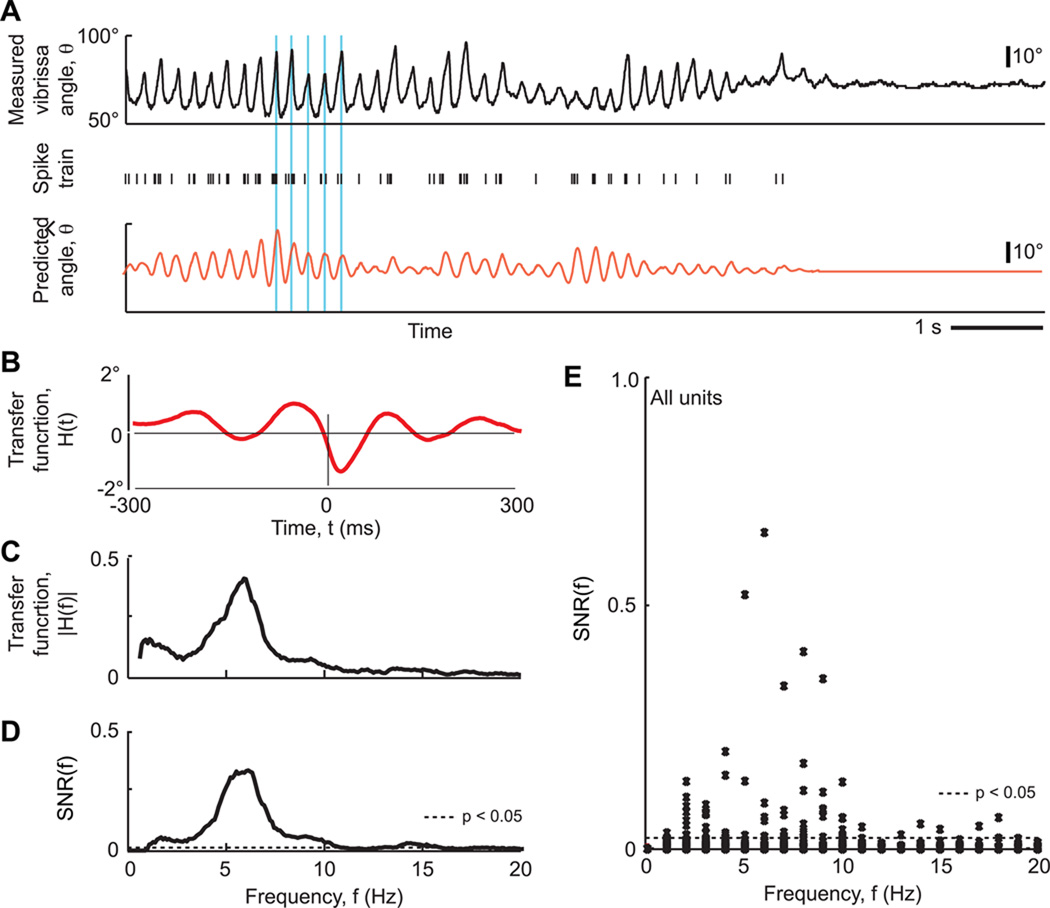
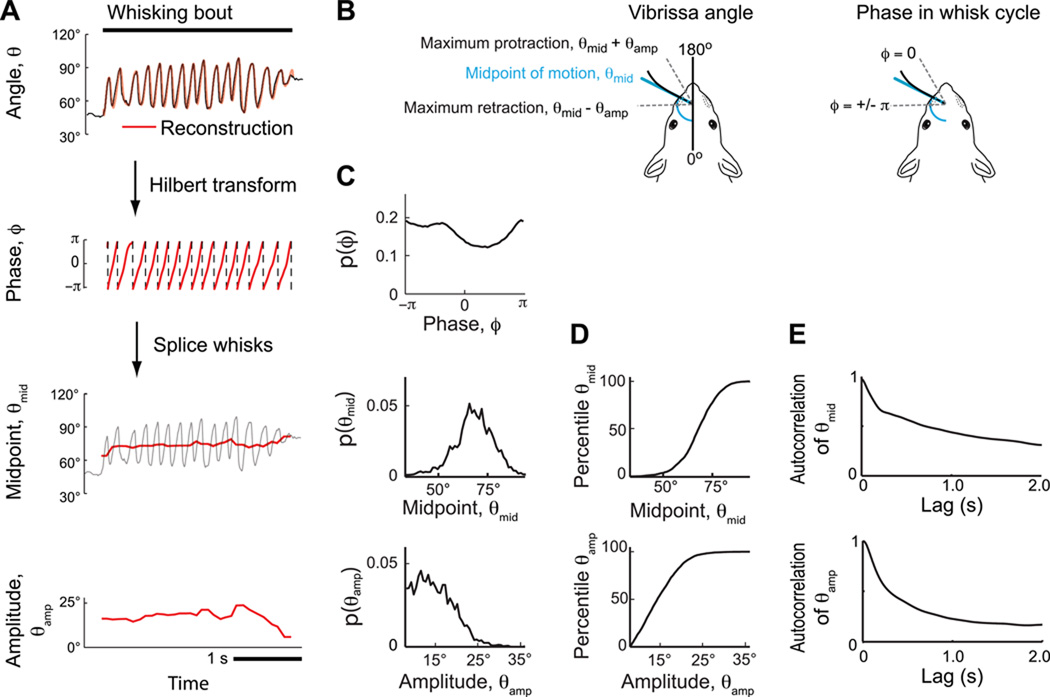
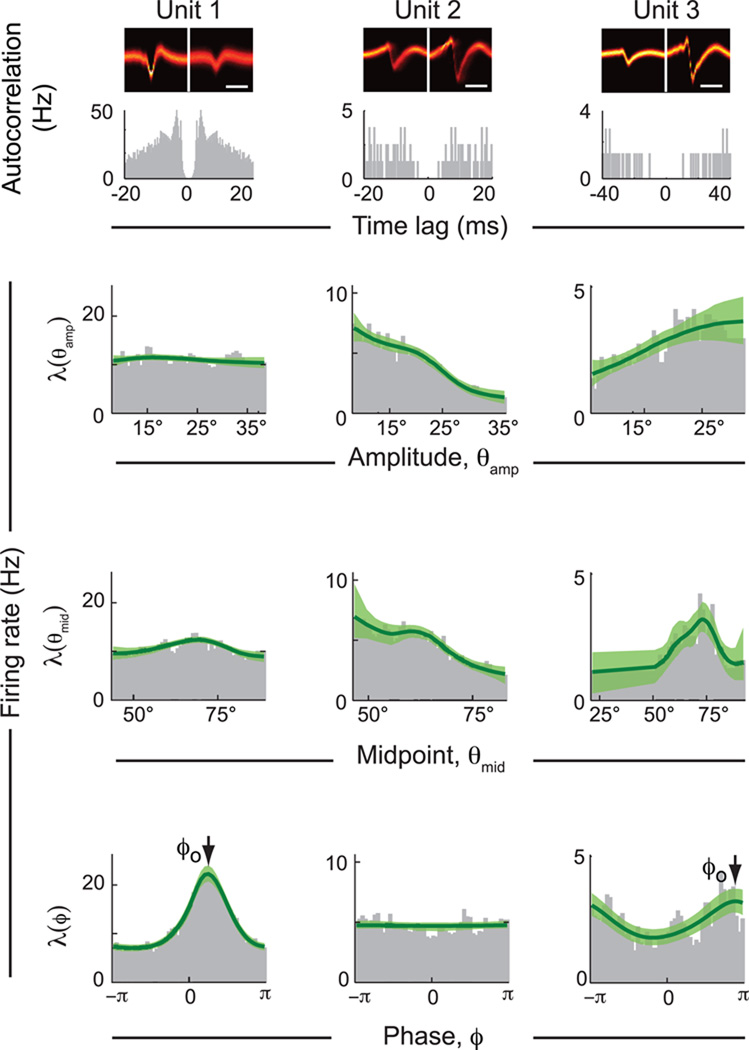
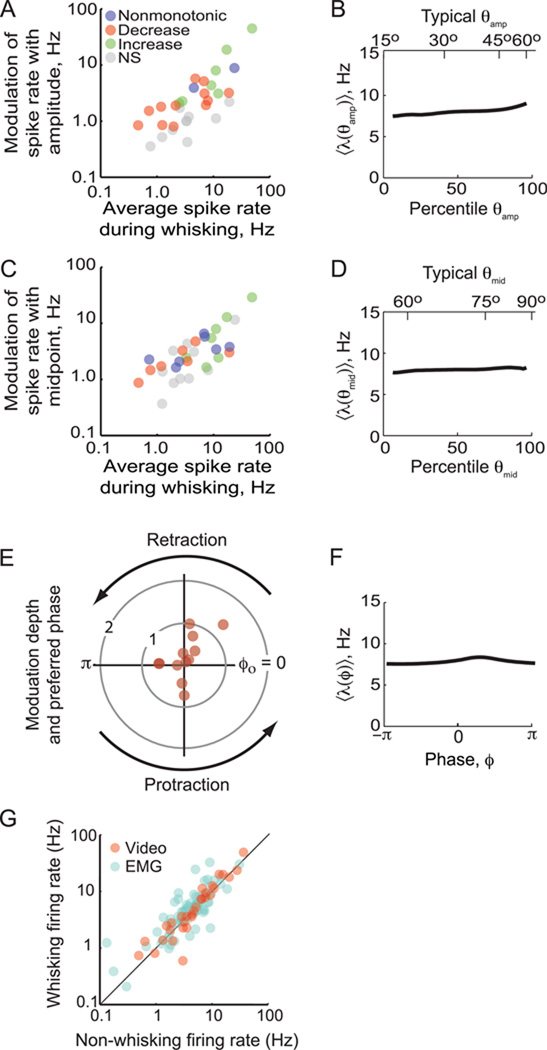
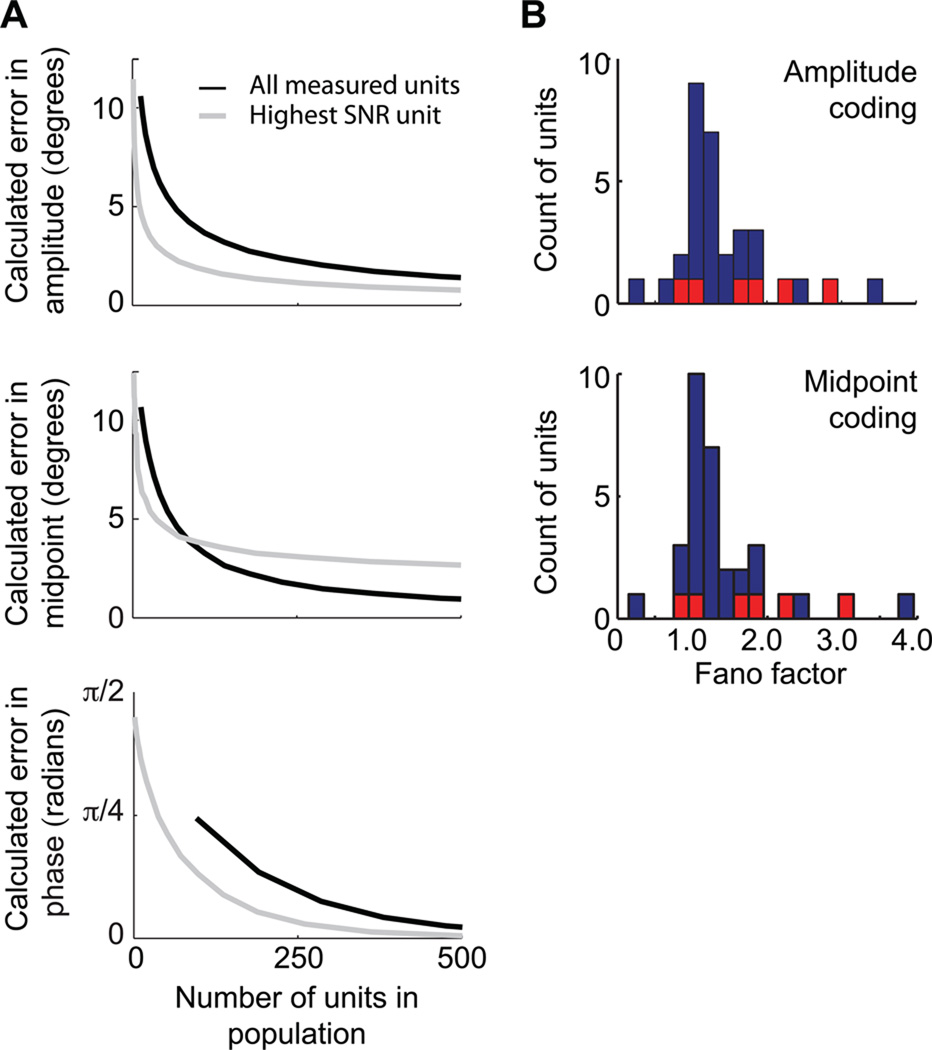
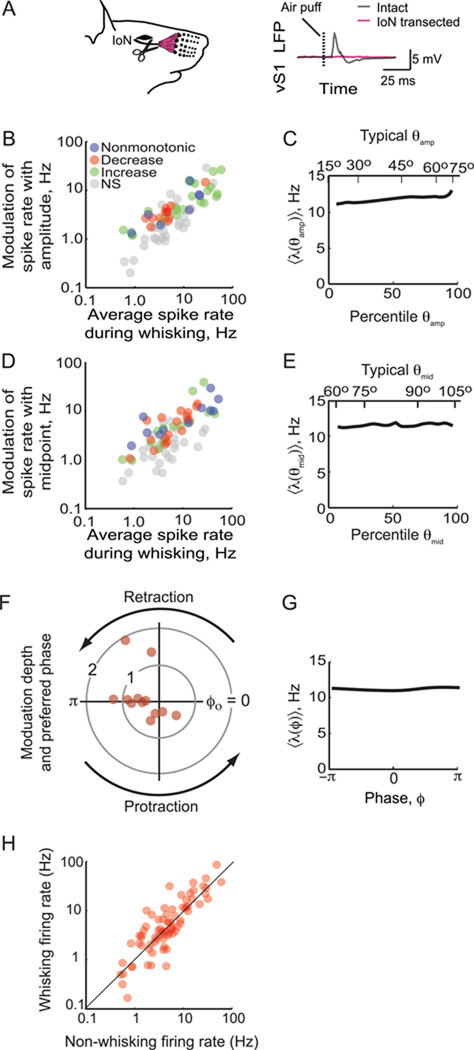
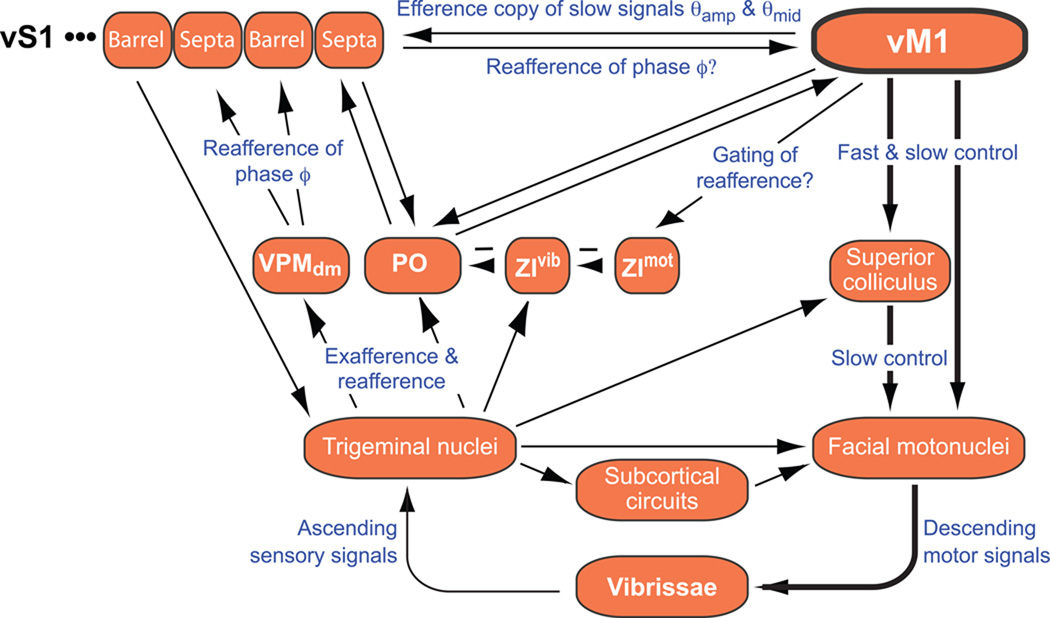
Exploratory whisking in rat is an example of self-generated movement on multiple timescales, from slow variations in the envelope of whisking to the rapid sequence of muscle contractions during a single whisk cycle. We find that, as a population, spike trains of single units in primary vibrissa motor cortex report the absolute angle of vibrissa position. This representation persists after sensory nerve transection, indicating an efferent source. About two-thirds of the units are modulated by slow variations in the envelope of whisking, while relatively few units report rapid changes in position within the whisk cycle. The combined results from this study and past measurements, which show that primary sensory cortex codes the whisking envelope as a motor copy signal, imply that signals present in both sensory and motor cortices are necessary to compute angular coordinates based on vibrissa touch.


Figures

Figure 1
Figure 1. Experimental setups and uniformity of whisking behavior
(A) Head-constraint apparatus. The animal’s head is held in place via a bolt embedded in its head mount. The array of vibrissae is trimmed down to a single row. Whisking is evoked by placing the home cage just out of reach. A high-speed camera is used to track vibrissa motion, and embedded microwires are used to record cortical units and EMG signals. (B) Apparatus for free ranging animals that explore a raised platform. All other experimental features are as in panel A, except no vibrissae are trimmed and their motion is not tracked. (C) Example of primary data taken in a behavioral session, including neuronal activity from both channels of stereotrode, spike trains from two sorted units, rectified ∇EMG of the protractor muscles, and position of the tracked vibrissa. An * indicates a possible double-pump whisk cycle. (D) Waveform and spike train autocorrelation for sorted units in panel C. (E) Videograph of a head-fixed rat with four tracked vibrissae, spanning rows D and E and arcs 1 to 4. (F) The motion of the four vibrissae versus time, superimposed on top of the motion calculated from only the first mode of the singular value decomposition (gray).
Figure 2
Figure 2. Absence of a strong linear relation between spike trains and whisking behavior
(A) Example of measured vibrissa position and concurrent single-unit spike train, together with the vibrissa position predicted from the spike train. The time-domain representation of the transfer function is shown in the lower right. Blue vertical lines are a visual guide to the correspondence between predicted and measured phase. Note the strong tracking of phase, the weak tracking of amplitude, and the loss of the value of the offset. (B) The representation of the transfer function in the time domain. (C) The same transfer function versus frequency. (D) The SNR(f) of the transfer function of the same unit. Horizontal line is cutoff for significance. (E) The SNR(f) for all units. Horizontal line is cutoff for significance.
Figure 3
Figure 3. Decomposition of whisking into rapidly and slowly varying parameters
(A) Top panel shows vibrissa position along with its reconstruction using a Hilbert transform. Lower panels show the phase, ϕ, as calculated from the Hilbert transform, along with the amplitude, θamp, and midpoint, θmid, of the envelope calculated from individual whisk cycles. Broken vertical lines indicate wrapping of phase from π to −π. (B) Schematic of the different angular parameters and their relation to phase in the whisk cycle for rhythmic motion. (C) Probability distribution functions for the phase, midpoint angle, and amplitude for all bouts in a session that included the data in panel A. (D) Mapping from angles to percentiles for the slow variables for the data in panel B. (E) Correlation coefficient of amplitude and midpoint as a function of time lag. Data is an average over rats (N = 5) and behavioral sessions (N ~ 12000 whisks).
Figure 4
Figure 4. Modulation profiles for three example units in vM1 cortex
The three columns are profiles of units that show different relative modulation by fast and slow signals. The respective stereotrode waveforms and spike train autocorrelations are shown at top. Each plot is calculated by dividing the distribution of the respective signal at spike time by the distribution of that signal over the entire behavioral session. Green lines are fits from the BARS smoothing algorithm along with the 95% confidence band. The symbol ϕo labels the peak of the tuning curve, or the preferred phase for spiking within the whisk cycle.
Figure 5
Figure 5. Summary of the coding of fast and slow time scales by single units
(A) Scatter plot of the modulation depth, defined as the maximum rate minus the minimum rate, for amplitude versus mean spike rate for each unit (N = 31). DIfferent colors distinguish increasing versus decreasing spike rate with an increase with angle, as noted. (B) The mean tuning curve for amplitude across the population. Data for slow variables were transformed into percentiles before averaging, as different vibrissae show distinct ranges of amplitude. The upper scale is the average angle for a given percentile (Fig. 3D). (C) Scatter plot of the modulation depth for midpoint versus mean spike rate for each unit (N = 31). (D) The mean tuning curve for midpoint across the population. The upper scale is the average angle for a given percentile (Fig. 3D). (E) Polar plot of the normalized modulation depth, defined as the maximum rate minus the minimum rate divided by the mean rate, as a function of the preferred phase for the unit, ϕo. Only points for significantly modulated units are plotted (N = 12). (F) The mean tuning curve as a function of phase across the population. (G) Firing rate of all units during whisking behavior recorded by videography (N = 32) or through the |∇EMG| (N = 69).
Figure 6
Figure 6. Estimated accuracy of coding as a function of population size
(A) Simulations of neuronal populations were either based on the entire measured data set (black line) or only on the unit with the highest recorded modulation (gray line). Errors were drawn from 1000 simulations of each value and weighted by their prior distributions. Top row. Mean error for amplitude estimation assuming a firing rate code and an integration time of T = 0.25 s. Middle row. Mean error for midpoint estimation assuming a firing rate code and an integration time of T = 0.25 s. Bottom row. Mean error for phase estimation assuming a linear code. (B) Histograms of the Fano factors computed in a 0.25 s window for all units; F = 1.0 is the limit of a Poisson counting process. The colored points correspond to fast spiking units (Fig. S3).
Figure 7
Figure 7. Summary of the coding of fast and slow time scales for units in vM1 cortex after transection of the IoN
(A) Diagram of the IoN branch of the trigeminal nerve, along with the mean LFP response in vS1 cortex to 50 puffs to the vibrissa shown before and after bilateral nerve transection. (B) Scatter plot of the modulation depth of amplitude versus mean spike rate for all units after nerve transection (N = 78). (C) The mean tuning curve for amplitude across the population. Data for slow variables were transformed into percentiles before averaging, as different vibrissae show distinct ranges of amplitude. The upper scale is the average angle for a given percentile (Fig. 3D). (D) Scatter plot of the modulation depth of midpoint versus mean spike rate for all units after nerve transaction (N = 74). (E) The mean tuning curve for midpoint across the population. The upper scale is the average angle for a given percentile (Fig. 3D). (F) Polar plot of the normalized modulation depth as a function of the preferred phase for the unit, ϕo; only points for significantly modulated units are plotted (N = 12). (G) The mean tuning curve as a function of phase across the population. (H) Firing rate of all units during whisking behavior (N = 78).
Figure 8
Figure 8. Diagram of signal flow within loops that encompass vM1 cortex in the vibrissa sensorimotor system
We shown only the subset of sensorimotor pathways that encompass the known flow of spike-based signaling in the rodent (Chakrabarti and Alloway, 2006; Kleinfeld et al., 2006; Urbain and Deschênes, 2007); the diagram is thus incomplete, especially with regard to basal ganglia (Hoffer et al., 2005) and cerebellar circuits (Lang et al., 2006; O'Connor et al., 2002). Minus signs mark inhibitory pathways. The brainstem nuclei include a hypothetical central pattern generator. Symbols: VPM, ventral posterior medial thalamus; PO, posterior medial thalamus, ZIvmot and ZLvvib, motor and vibrissa subdivision, of ventral zona incerta, respectively. Functional projections are labeled in blue.

Comment in

References

    1. Ahissar E, Sosnik R, Haidarliu S. Transformation from temporal to rate coding in a somatosensory thalamocortical pathway. Nature. 2000;406:302–306. - PubMed
    1. Ahrens KF, Kleinfeld D. Current flow in vibrissa motor cortex can phase-lock with exploratory whisking in rat. Journal of Neurophysiology. 2004;92:1700–1707. - PubMed
    1. Arvidsson J, Rice FL. Central projections of primary sensory neurons innervating different parts of the vibrissae follicles and intervibrissal skin on the mystacial pad of the rat. Journal of Comparative Neurology. 1991;309:1–16. - PubMed
    1. Berg RW, Kleinfeld D. Rhythmic whisking by rat: Retraction as well as protraction of the vibrissae is under active muscular control. Journal of Neurophysiology. 2003a;89:104–117. - PubMed
    1. Berg RW, Kleinfeld D. Vibrissa movement elicited by rhythmic electrical microstimuation to motor cortex in the aroused rat mimics exploratory whisking. Journal of Neurophysiology. 2003b;90:2950–2963. - PubMed

Publication types

LinkOut - more resources