. 2011 Oct 20;10(4):410-9.
doi: 10.1016/j.chom.2011.09.004.

The phosphoproteomes of Plasmodium falciparum and Toxoplasma gondii reveal unusual adaptations within and beyond the parasites' boundaries

Affiliations

The phosphoproteomes of Plasmodium falciparum and Toxoplasma gondii reveal unusual adaptations within and beyond the parasites' boundaries

Moritz Treeck et al. Cell Host Microbe. .

Abstract

Plasmodium falciparum and Toxoplasma gondii are obligate intracellular apicomplexan parasites that rapidly invade and extensively modify host cells. Protein phosphorylation is one mechanism by which these parasites can control such processes. Here we present a phosphoproteome analysis of peptides enriched from schizont stage P. falciparum and T. gondii tachyzoites that are either "intracellular" or purified away from host material. Using liquid chromatography-tandem mass spectrometry, we identified over 5,000 and 10,000 previously unknown phosphorylation sites in P. falciparum and T. gondii, respectively, revealing that protein phosphorylation is an extensively used regulation mechanism both within and beyond parasite boundaries. Unexpectedly, both parasites have phosphorylated tyrosines, and P. falciparum has unusual phosphorylation motifs that are apparently shaped by its A:T-rich genome. This data set provides important information on the role of phosphorylation in the host-pathogen interaction and clues to the evolutionary forces operating on protein phosphorylation motifs in both parasites.


Figures

Figure 1
Figure 1. Generation of phosphoproteome and proteome data of P. falciparum and T. gondii parasites
A) Details on the generation of protein samples of intracellular P. falciparum and Toxoplasma parasites and Toxoplasma parasites purified from host cell material. B) Protein samples from A) were digested with trypsin and fractionated on a SCX (strong cation exchange) column followed by enrichment of phosphopeptides and peptides using IMAC beads in StageTips. The resulting phosphopeptide samples and flow-through samples were analyzed on an LTQ-Velos Orbitrap mass-spectrometer. Spectra were identified using SEQUEST and the resulting data were filtered using the target-decoy strategy to obtain false-discovery rates (FDR) < 1% on the peptide level and < 3% on the protein level. Ascore was used for the assessment of phosphorylation site localization. Phosphorylation sites with an Ascore of 19 or higher are called “localized”. C) Table showing the total number of phosphopeptides and peptides identified, the total number of phosphorylation sites identified (before Ascore filtering) and the number of corresponding proteins and phosphoproteins to which these map. D) Distribution and number of localized phosphorylation sites. The number of identified phosphoserine (pS), phosphothreonine (pT) and phosphotyrosine (pY) sites are given along with their percentage of the total phosphosites identified for each of the three phosphoproteome datasets. Only phosphorylation sites with an Ascore ≥19 were counted. E) Structural characterization of phosphorylation sites. Left graph: All identified phosphorylation sites (Pf.Phos and Tg.Phos) and all non-phosphorylated sites (Pf.NonPhos and Tg.NonPhos) from all identified proteins were analyzed using Psipred and VSL2 and the number located in predicted regions of disorder or order were plotted. Right graph: Results of a secondary structure prediction for regions containing phosphorylated and non-phosphorylated residues. Only phosphorylation sites with an Ascore ≥19 were counted. See also supplementary Figure S1 and Tables S1A and S1B.
Figure 2
Figure 2. Comparative analysis of phosphorylation sites
A) Amino acid frequencies in the 12 residues (6 N-terminal and 6 C-terminal) surrounding each phosphoserine and phosphothreonine residue identified in this study and in mouse (Huttlin et al., 2010). The central serine or threonine was not counted. Only phosphorylation sites from P. falciparum and intracellular T. gondii with an Ascore ≥19 were used for this analysis. B) Enrichment and depletion of amino acid frequencies around phosphoserines and phosphothreonines (combined) using the 13-mer datasets described in A) compared to amino acid frequencies of non-phosphorylated serine/threonine-containing 13-mers. A negative log2 score shows depletion of this residue in the 12 amino acids surrounding a phosphorylation site whereas a positive log score shows enrichment. C) A position-specific intensity map of P. falciparum shows enrichment or depletion of amino acids relative to the phosphorylated serine or threonine compared to all non-phosphorylated serine or threonine residues of the datasets in B), above. The percentage frequency of a given amino acid in the set of all phosphoserine- or phosphothreonine-containing 13-mers is indicated on the right of the graph. Colors represent the log10 of the ratio of frequencies in the respective phospho-13-mers vs. nonphospho13-mers (red indicates enrichment, grey indicates depletion). The table shows specific phosphorylation motifs identified in the P. falciparum phosphoproteome. A red S or T indicates the phosphorylated residue; a red asterisk indicates a motif not present in humans. D) Phosphorylation motif analysis. Phosphorylation motif analysis was performed using the motif-x algorithm. All identified phosphorylation motifs were classified as one of six phosphorylation motif categories (acidic-, basic-, proline-, asparagine- or hydrophobic-directed or “other”). Motifs were assigned using binary decision tree: P in the +1 position (proline-directed), [R/K] in the -3 position (basic), [D/E] in the +1- +3 position, >2 [D/E] in the +1-+6 position (acidic), [F/I/L/M] in the +1 position (hydrophobic), or [N] in any specific position over background (asparagine). See also supplementary Figure S2 and Table S2.
Figure 3
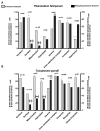
Figure 3. Relative representation of functional protein groups in the detected proteome and phosphoproteome
All identified proteins and phosphoproteins were matched to selected functional groups of proteins from A) P. falciparum and B) intracellular T. gondii and analyzed for over- or underrepresentation in the total detected proteome and phosphoproteome. The total number of predicted proteins within each group is indicated (n=x). “*” indicates significant over- or underrepresentation (brackets) within the total identified proteome (that contains all phosphoproteins and non-phosphoproteins) compared to the total predicted proteome as indicated by the grey bars and plotted on the left vertical axis. “**” indicates significant over- or underrepresentation (brackets) of detected phosphoproteins compared to the total proteome detected in this study as indicated by the black bars and plotted on the left vertical axis. Significance was calculated using χ2 and a p-value <0.05. See also supplementary Table S3.
Figure 4
Figure 4. Identification of proteins that are phosphorylated after host cell invasion
A) Spectral counts of Toxoplasma non-phosphorylated peptides and phosphopeptides were pooled for each protein and compared between “intracellular” samples (x-axis; containing all parasite proteins including those injected/exported into the host cell) and purified tachyzoites that have been largely depleted of host-cell material (y-axis). For proteins that yielded no spectral counts for phosphopeptides in the purified samples, a phantom count of 0.01 was given to allow inclusion in the logarithmically plotted graph. Each red dot indicates a protein from which one or more phosphopeptides were identified. Black dots represent proteins with no evidence of phosphorylation. B) As in A) except only phosphoproteins are shown and red dots indicate outliers for which the number of spectral counts identified for phosphopeptides in the “intracellular” fraction was both a minimum of 5 in the “intracellular” sample and>2-fold higher in the “intracellular” vs. purified samples, indicating proteins that are likely phosphorylated within the parasitophorous vacuole or host cytosol. C) Change of abundance of phosphoproteome outliers in the non-phosphoproteome. As in B) except spectral counts for nonphosphopeptides are plotted. D) Enrichment for proteins with a predicted signal peptide in outlier phosphoproteins. The percentage of proteins with a predicted signal peptide is plotted relative to the total number of proteins in each of four sets: the total predicted proteome; the combined nonphosphorylated proteome detected in this study; the combined phosphoproteome; and the 123 outlier phosphoproteins described in B), above. “**” indicates a statistically significant difference between the outliers and the combined phosphoproteome sets. Error bars represent ± SD. See also supplementary Table S4.

Similar articles

Cited by

References

    1. Abe K, Aoyagi A, Saito H. Sustained phosphorylation of mitogen-activated protein kinase is required for basic fibroblast growth factor-mediated axonal branch formation in cultured rat hippocampal neurons. Neurochem Int. 2001;38:309–315. - PubMed
    1. Beausoleil SA, Villen J, Gerber SA, Rush J, Gygi SP. A probability-based approach for high-throughput protein phosphorylation analysis and site localization. Nat Biotechnol. 2006;24:1285–1292. - PubMed
    1. Billker O, Lourido S, Sibley LD. Calcium-dependent signaling and kinases in apicomplexan parasites. Cell Host Microbe. 2009;5:612–622. - PMC - PubMed
    1. Bodenmiller B, Mueller LN, Mueller M, Domon B, Aebersold R. Reproducible isolation of distinct, overlapping segments of the phosphoproteome. Nature methods. 2007;4:231–237. - PubMed
    1. Boothroyd JC, Dubremetz JF. Kiss and spit: the dual roles of Toxoplasma rhoptries. Nature reviews. 2008;6:79–88. - PubMed

Publication types