. 2011 Oct 25;58(18):1893-902.
doi: 10.1016/j.jacc.2011.07.029.

The electrophysiological cardiac ventricular substrate in patients after myocardial infarction: noninvasive characterization with electrocardiographic imaging

Affiliations

The electrophysiological cardiac ventricular substrate in patients after myocardial infarction: noninvasive characterization with electrocardiographic imaging

Phillip S Cuculich et al. J Am Coll Cardiol. .

Abstract

Objectives: The aim of this study was to noninvasively image the electrophysiological (EP) substrate of human ventricles after myocardial infarction and define its characteristics.

Background: Ventricular infarct border zone is characterized by abnormal cellular electrophysiology and altered structural architecture and is a key contributor to arrhythmogenesis. The ability to noninvasively image its electrical characteristics could contribute to understanding of mechanisms and to risk-stratification for ventricular arrhythmia.

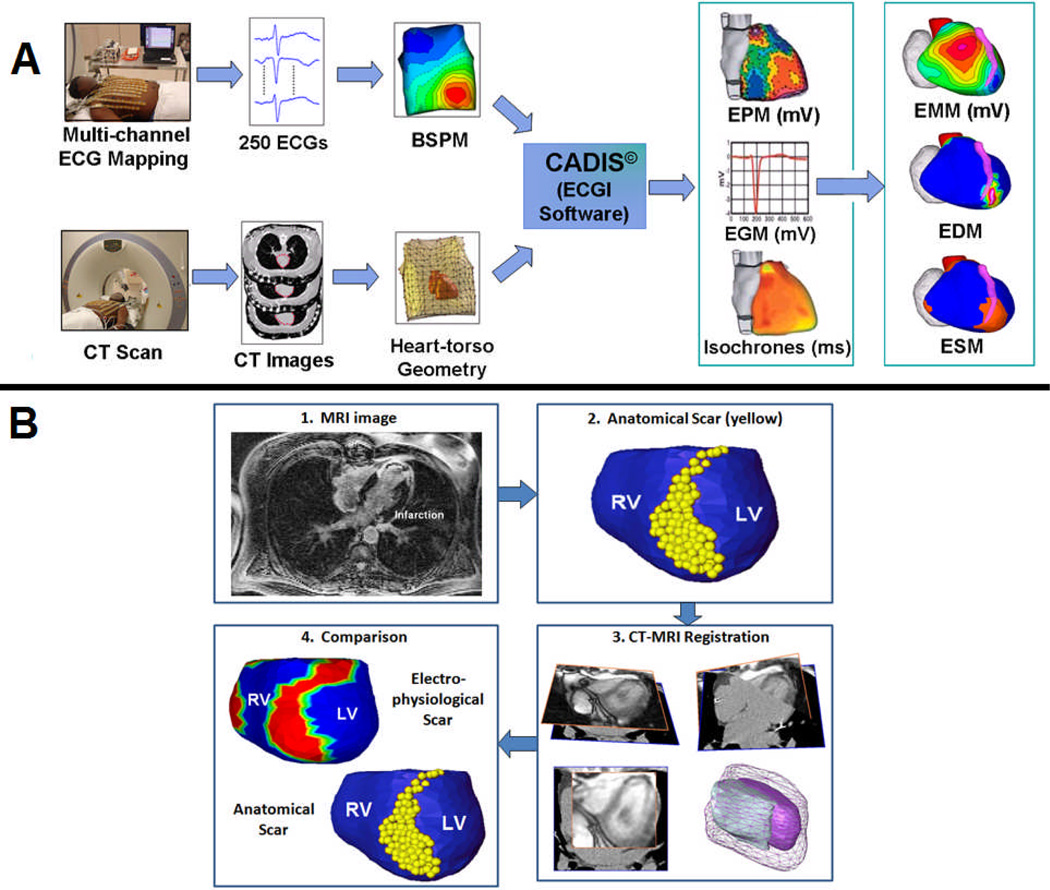
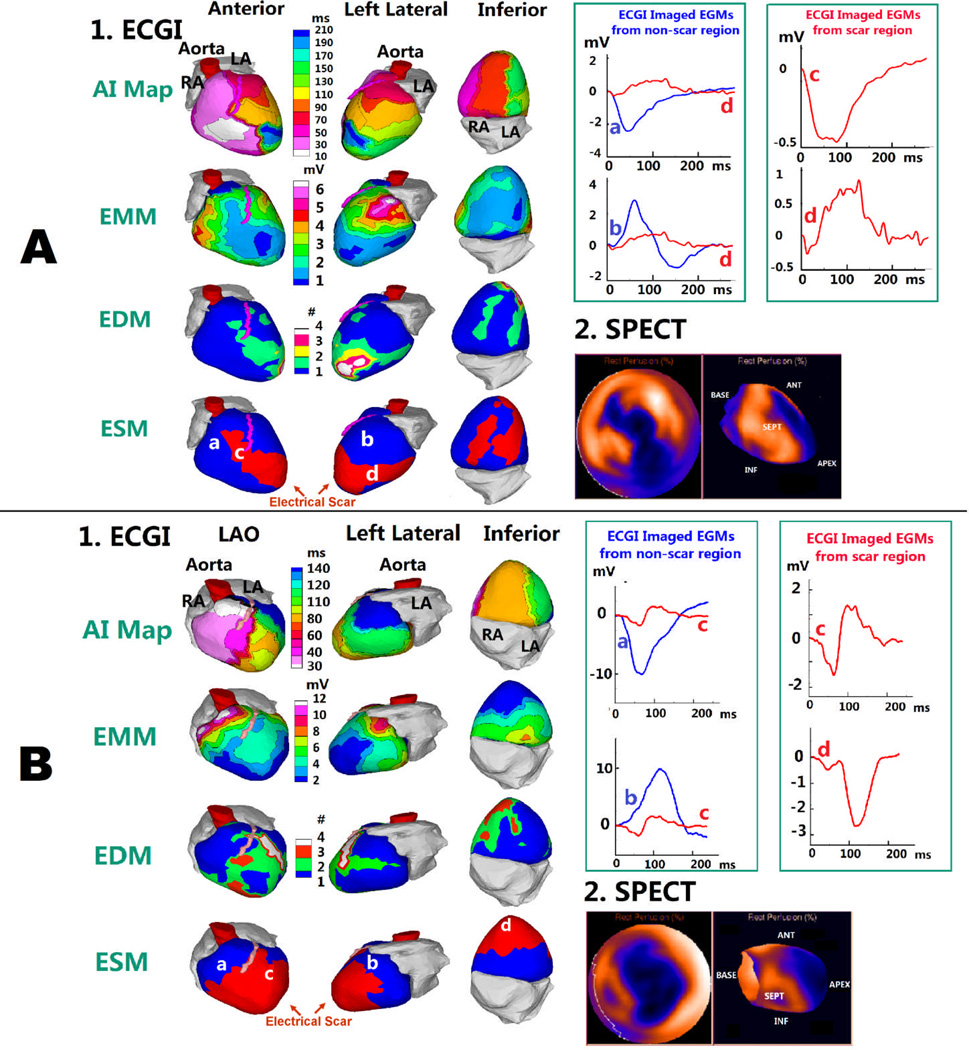
Methods: Electrocardiographic imaging, a noninvasive functional EP imaging modality, was performed during sinus rhythm (SR) in 24 subjects with infarct-related myocardial scar. The abnormal EP substrate on the epicardial aspect of the scar was identified, and its location, size, and morphology were compared with the anatomic scar imaged by other noninvasive modalities.

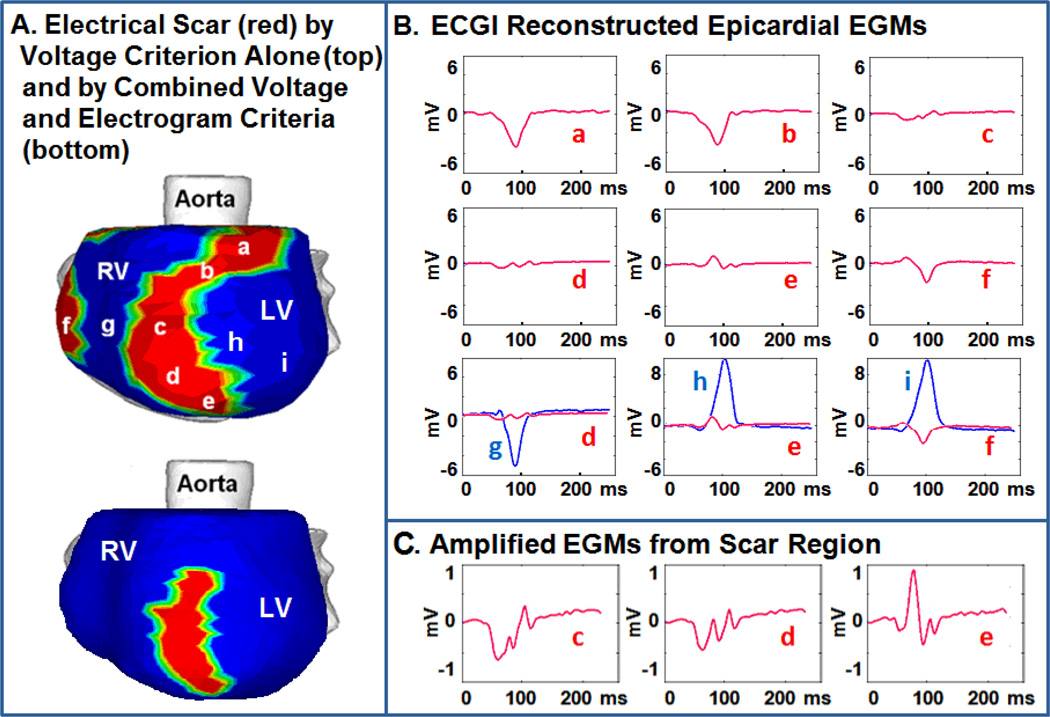
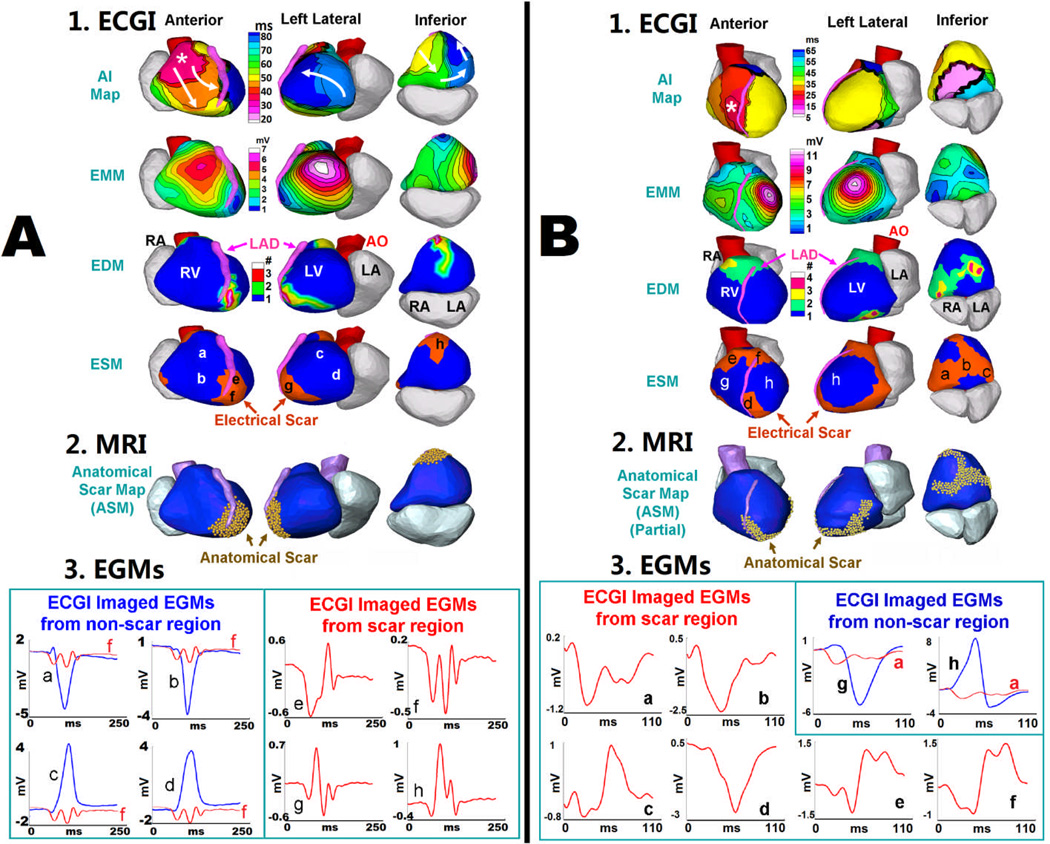
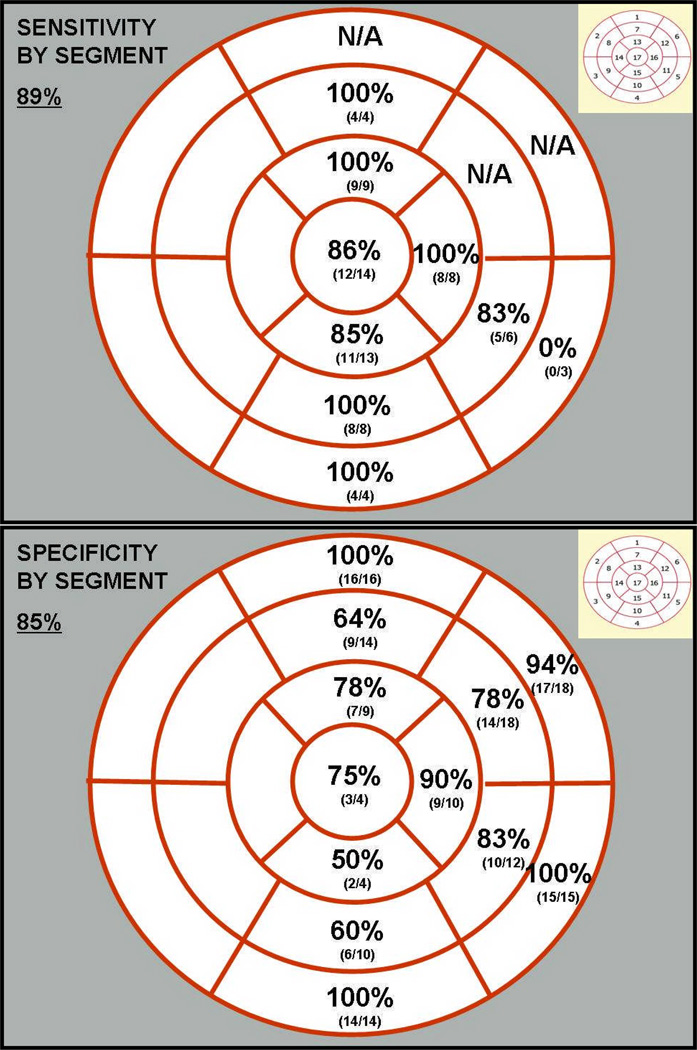
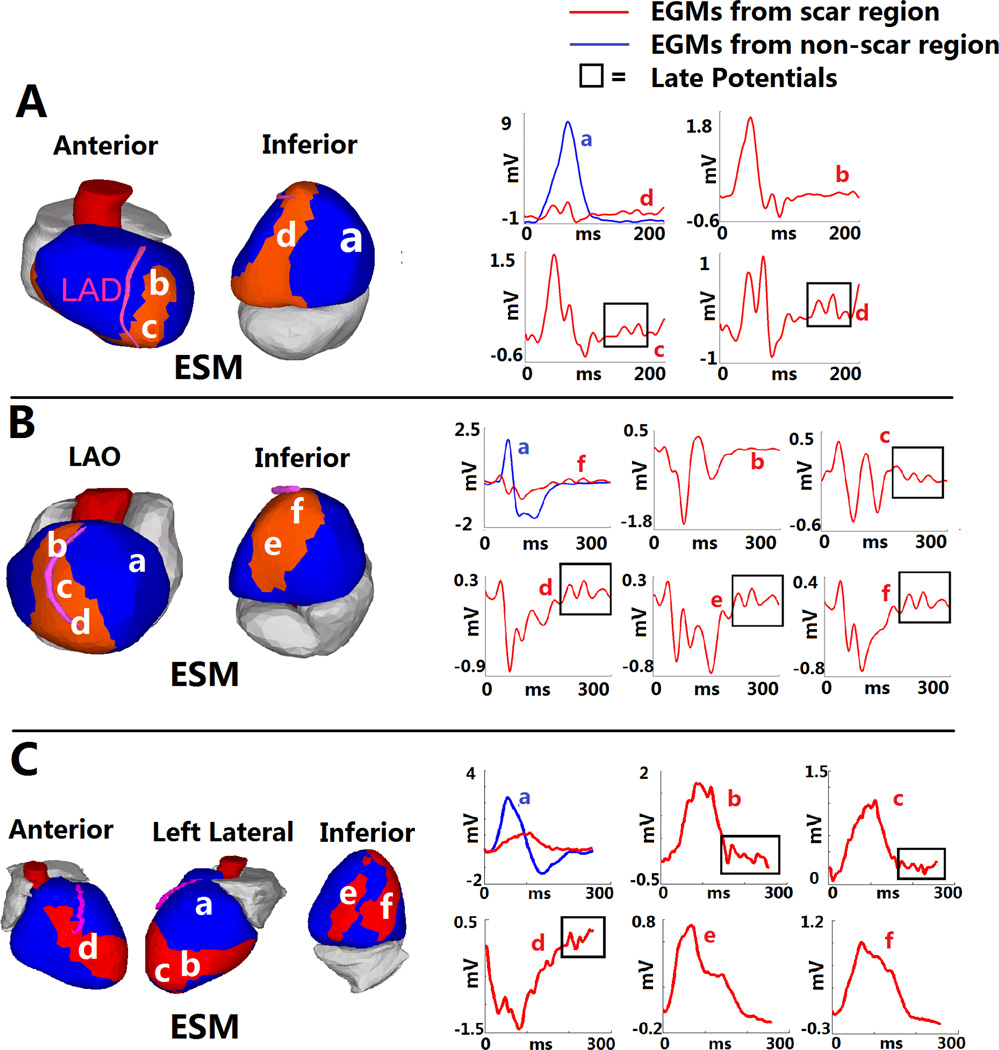
Results: Electrocardiographic imaging constructs epicardial electrograms that have characteristics of reduced amplitude (low voltage) and fractionation. Electrocardiographic imaging colocalizes the epicardial electrical scar to the anatomic scar with a high degree of accuracy (sensitivity 89%, specificity 85%). In nearly all subjects, SR activation patterns were affected by the presence of myocardial scar. Late potentials could be identified and were almost always within ventricular scar.

Conclusions: Electrocardiographic imaging accurately identifies areas of anatomic scar and complements standard anatomic imaging by providing scar-related EP characteristics of low voltages, altered SR activation, electrogram fragmentation, and presence of late potentials.


Figures

Figure 1
Figure 1
A: The ECGI Procedure. Recorded body surface potentials and CT-imaged geometry are processed mathematically to obtain noninvasively potential maps (EPM), electrograms (EGM), and activation sequences (isochrones). From these data, electrogram magnitude maps (EMM), electrogram deflection maps (EDM) and electrical scar maps (ESM) are constructed (see text for details). ESM, defined by combining low magnitude potentials and EGMs with multiple deflections, is shown in red. B: Comparing electrical scar to anatomical scar. Anatomical scar is imaged with DE-MRI and, annotated (yellow dots) on the reconstructed cardiac geometry. The MRI image and CT from ECGI are co-registered to construct the anatomic scar map. A comparison of electrical (red) and anatomical (yellow) maps of scar on the anterior epicardial aspect of the interventricular septum is shown in B.4.
Figure 2
Figure 2
EGM Characteristics A: Electrical scar (red) is shown in the left anterior obligue view. Top image uses a reduced voltage criterion to identify scar. Bottom image uses reduced voltage and EGM fractionation to identify scar. B: EGMs a,b and f (red) from low voltage regions demonstrate low amplitude alone. EGMs c–e (red) demonstrate both fractionation and low amplitude. EGMs g–i (blue) from neighboring regions outside the scar demonstrate considerably larger amplitude and single deflection. C: EGMs c–e amplified to clearly demonstrate multiple deflections.
Figure 3
Figure 3
Relationship between ECGI-derived Electrical Scar and DE-MRI Anatomic Scar. A: Apical MI. 1, top to bottom: SR activation map (AI map), EMM, EDM and ESM (three views). Asterisk in AI map marks the RV breakthrough site of earliest activation; arrows show wavefront propagation. Latest activation is in LV apex (dark blue) which is abnormal. ESM demonstrates an electrical scar at apex (red). 2: Anatomical scar map from DE-MRI (gold) shows similar apical distribution of scar. 3: Four selected EGMs from non-scar region (blue) and from scar region (red) (locations indicated on ESM). Scar EGMs are shown together with non-scar EGMs to demonstrate magnitude difference, and on amplified scale to show clearly multiple deflections (fractionation). B: Inferior MI. Similar format to panel A. SR activation of the inferior septum is abnormal (pink region in AI map). ESM demonstrates electrical scar that extends across the inferior wall and toward the apex, similar to the anatomical scar
Figure 4
Figure 4
Segmental sensitivity and specificity of ECGI electrical scar imaging compared to rest myocardial perfusion imaging (SPECT). Standard 17-segment classification for sensitivity (top) and specificity (bottom) analyses. Septal segments were excluded.
Figure 5
Figure 5
Relationship between ECGI-derived Electrical Scar and SPECT Anatomic Scar. Similar format to Figure 3, except SPECT images replace MRI scar maps. A: Apical MI. Latest activation is in the anterior apex (dark blue in AI map), which is abnormal. ESM demonstrates an electrical scar in the apex, extending anteriorly and inferiorly (red). Resting myocardial perfusion images (SPECT), shown in a standard “bullseye” configuration (left) and long-axis view (right), demonstrate large area of infarction in the anterior, apical and inferior LV. B: Apical Aneurysm. ESM demonstrates a large electrical scar across the apex. SPECT imaging shows similar extensive apical distribution of scar.
Figure 6
Figure 6
Late Potentials within Electrical Scar. A: ESM from a patient with inferoapical scar. Three EGMs from the scar are shown on the right (b,c and d; red). Scar EGM d is also shown together with non-scar EGM a (blue) in the upper left panel, to highlight differences. EGMs c and d demonstrate late deflections (“late potentials”) (box). LPs were observed almost exclusively within electrical scar. However (EGM b), LPs were not present in all scar regions. B: Anteroapical infarct. LPs are present in EGMs from inferior and apical regions (c–f), but not the anterior region (b). C: Complex anterior, apical and inferior infarction. LPs are present in several EGMs from the anterior and apical regions (b–d), but not the inferior region (e,f).

References

    1. Mahrholdt H, Wagner A, Holly TA, et al. Reproducibility of chronic infarct size measurement by contrast-enhanced magnetic resonance imaging. Circulation. 2002;106:2322–2327. - PubMed
    1. Bello D, Fieno DS, Kim RJ, et al. Infarct morphology identifies patients with substrate for sustained ventricular tachycardia. J Am Coll Cardiol. 2005;45:1104–1108. - PubMed
    1. Schmidt A, Azevedo CF, Cheng A, et al. Infarct tissue heterogeneity by magnetic resonance imaging identifies enhanced cardiac arrhythmia susceptibility in patients with left ventricular dysfunction. Circulation. 2007;115:2006–2014. - PMC - PubMed
    1. Yan AT, Shayne AJ, Brown KA, et al. Characterization of peri-infarct zone by contrast-enhanced magnetic resonance imaging is a powerful predictor of post-myocardial infarction mortality. Circulation. 2006;114:32–39. - PubMed
    1. Peters NS, Wit AL. Myocardial architecture and ventricular arrhythmogenesis. Circulation. 1998;97:1746–1754. - PubMed

Publication types