

doi: 10.1186/gb-2011-12-10-r104.
High-throughput RNA interference screening using pooled shRNA libraries and next generation sequencing
Affiliations
- PMID: 22018332
- PMCID: PMC3333774
- DOI: 10.1186/gb-2011-12-10-r104
Item in Clipboard
High-throughput RNA interference screening using pooled shRNA libraries and next generation sequencing
Genome Biol.
.
Abstract
RNA interference (RNAi) screening is a state-of-the-art technology that enables the dissection of biological processes and disease-related phenotypes. The commercial availability of genome-wide, short hairpin RNA (shRNA) libraries has fueled interest in this area but the generation and analysis of these complex data remain a challenge. Here, we describe complete experimental protocols and novel open source computational methodologies, shALIGN and shRNAseq, that allow RNAi screens to be rapidly deconvoluted using next generation sequencing. Our computational pipeline offers efficient screen analysis and the flexibility and scalability to quickly incorporate future developments in shRNA library technology.
Figures
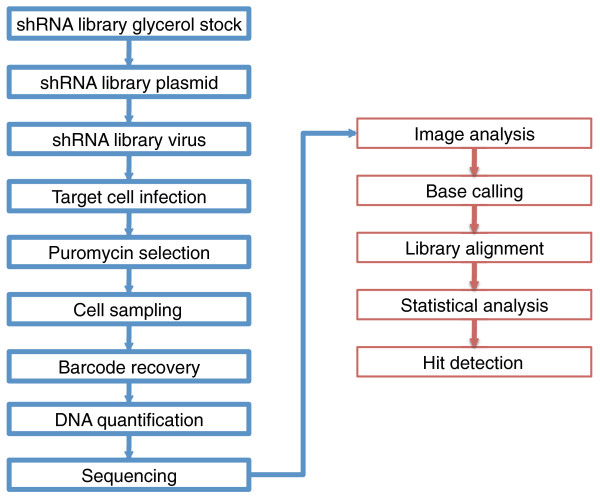
Workflow of a typical shRNA barcode screen. The steps in blue boxes represent the experimental phase, whereas the steps in red boxes represent the computational analysis phase.
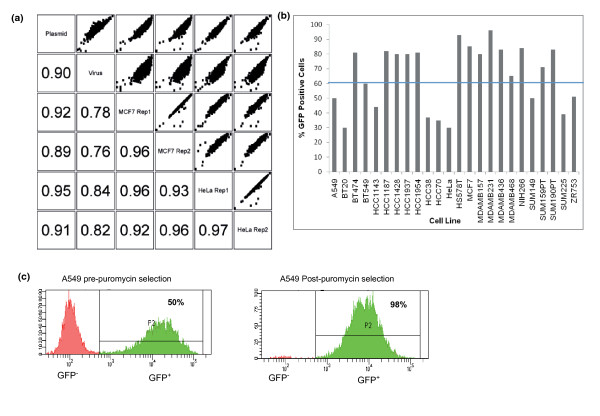
GIPZ library plasmid/viral pool production and target cell line infection. (a) Scatter plots showing pair-wise comparisons of log2 normalized read counts from shRNA plasmid, virus and two technical replicates of shRNA constructs amplified from genomic DNA 3 days post-infection of MCF7 and HeLa cells. Numbers indicate Pearson correlation between conditions. Technical replicates show high correlation. Plasmid shows high correlation with infected cells in both cell lines. Virus shows weaker correlation with both plasmid and infected cells. (b) Test infection of a panel of breast cancer cell lines. Most cell lines show >60% green fluorescent protein (GFP)-positive cells 3 days after infection. Those that did not were puromycin selected to increase the population of GFP-positive cells to >90%. (c) Fluorescence-activated cell sorting (FACS) profiles showing the percentage of GFP-positive cells before and after puromycin selection in A549 cells.
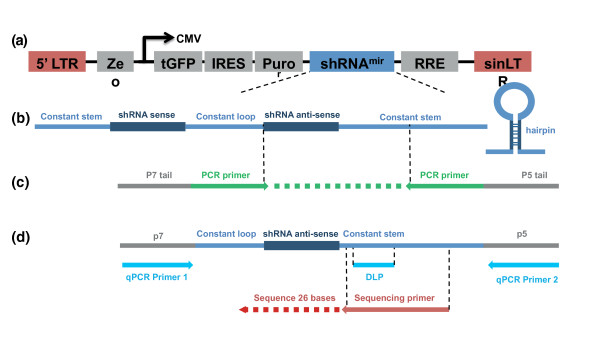
PCR amplification, quantitative PCR and Illumina sequencing schema. (a) Diagrammatic representation of the complete integrated shRNA construct. LTR, long terminal repeat; Ze, zeomycin resistance bacterial selectable marker; tGFP, turbo GFP; IRES, internal ribosome entry site; Puro, puromycin mammalian selectable marker; RRE, Rev response element; sinLT, self-interacting LTR. (b) The structure of the shRNAmir construct. The sense and antisense shRNA sequences hybridize to form a hairpin loop structure. (c) PCR primer alignment to the shRNA construct. The PCR primers incorporate p7 and p5 sequences to enable capture on an Illumina flowcell. (d) Sequencing primer, quantitative PCR (qPCR) primer and qPCR dual label probe alignment to the shRNA PCR product. CMV, cytomegalovirus; DLP, dual-labeled probe.
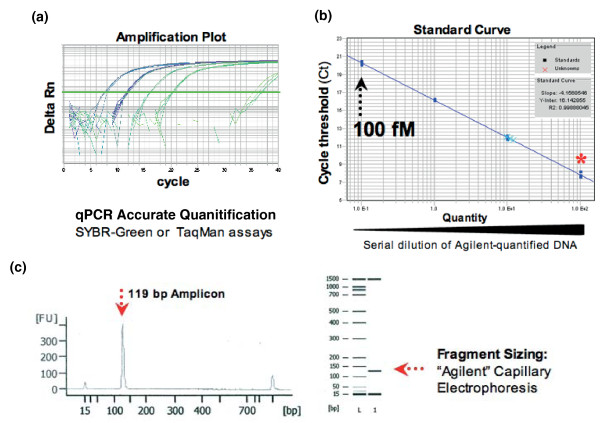
Quantitative PCR quantification of PCR products. Quantitative PCR (qPCR) assay designed to detect and quantify all amplifiable solexa molecules (using oligos p5/p7 and SybrGreen) or shRNA-specific PCR products (using Taqman, amplification primers p5/p7 and a dual-labeled probe). (a) shRNA PCR products quantified against a library of known concentration. (b) Standard curve constructed using a ten-fold dilution series covering 100, 10, 1 and 0.1 pM. (c) Agilent electrophoresis profile of reference library.
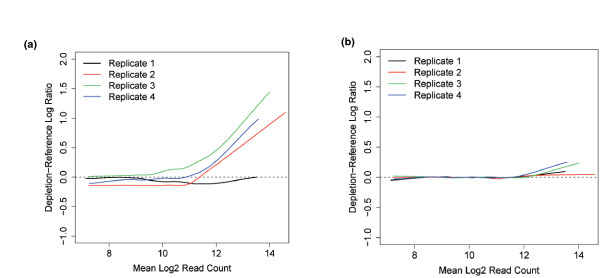
Processing screen data to remove biases associated with differential hairpin abundance. Plotting of the log ratio of paired samples (for example, reference-depletion) frequently revealed biases with respect to average hairpin abundance. Consequently, the data were normalized using loess regression to remove this bias. (a) The loess fit lines from four biological replicates of a 10k pool viability screen in MCF7 cells when the log ratio is plotted against log mean hairpin abundance. (b) The same plot post-loess normalization showing the standardization of the curves.
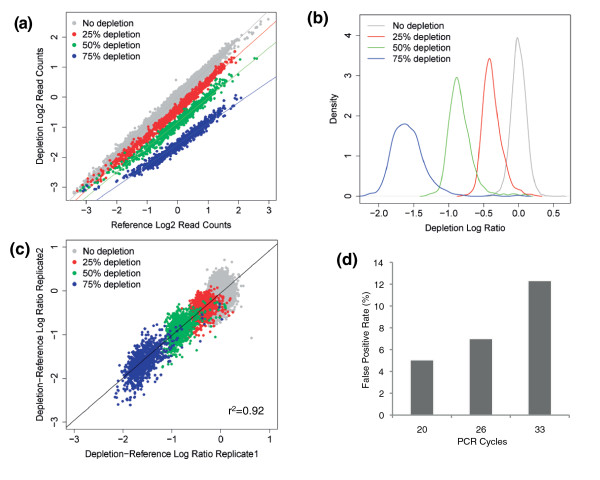
Assessing the sensitivity and reproducibility of the screening platform. We systematically depleted subsets of hairpins by 25%, 50% or 75% within a 10k pool and compared them to a non-depleted reference set 3 days after infection of MCF7 cells (see also Additional File 1). (a) Scatter plot of log2 normalized read counts from reference and depletion sets. (b) Density plot showing the distributions of the depleted hairpin subsets: 25% depleted hairpins are plotted in red, 50% depleted in green and 75% depleted in blue. The screening methodology was capable of detecting 50% depletion in hairpin representation with high accuracy in a single experiment. (c) Scatter plot of the depletion-reference log ratio from two biological replicates, indicating a high correlation (r2 = 0.92) and thus a reproducible screening method. (d) Plot depicting the false positive rate at a fixed false negative rate of 5% in a reference depletion experiment using different numbers of PCR cycles, indicating a decrease in the false positive rate with decreased PCR cycles.
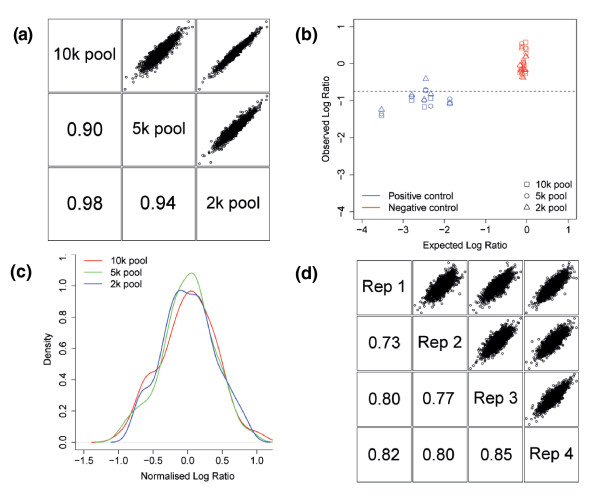
MCF7 viability screen performance in different pool sizes. (a) Scatter plots of 2,000 hairpins common to the 2,000, 5,000 and 10,000 shRNA pools showing high correlation of normalized scores (median of four replicates) between different pool sizes. Numbers indicate Pearson correlation between pools. (b) Plot of observed barcode screen log ratios for validated positive and negative controls in the 2,000, 5,000 and 10,000 shRNA pools versus expected scores based on single hairpin GFP competition assay scores. Positive controls are in blue and negative controls are in red. The horizontal dotted line indicates the threshold used for hit calling in the screen. Based on this threshold, 5 out of 6 valid positive controls were called hits whereas 0 out of 11 negative controls did not score as hits. (c) Distribution of log ratios of 101 non-targeting hairpins in the 2k pool. (d) Scatter plots of z-scores from four biological replicates of the 10k pool MCF7 viability screen, indicating a good agreement between replicates. Numbers indicate Pearson correlation between replicates.
References
-
- Schlabach MR, Luo J, Solimini NL, Hu G, Xu Q, Li MZ, Zhao Z, Smogorzewska A, Sowa ME, Ang XL, Westbrook TF, Liang AC, Chang K, Hackett JA, Harper JW, Hannon GJ, Elledge SJ. Cancer proliferation gene discovery through functional genomics. Science. 2008;319:620–624. doi: 10.1126/science.1149200. - DOI - PMC - PubMed
Publication types
MeSH terms
Substances
Grants and funding
LinkOut - more resources
Full Text Sources
Other Literature Sources
