

Direct comparison of fluorodeoxyglucose positron emission tomography and arterial spin labeling magnetic resonance imaging in Alzheimer's disease
- PMID: 22018493
- PMCID: PMC3264701
- DOI: 10.1016/j.jalz.2011.06.003
Direct comparison of fluorodeoxyglucose positron emission tomography and arterial spin labeling magnetic resonance imaging in Alzheimer's disease
Abstract
Background: The utility of fluorodeoxyglucose positron emission tomography (FDG-PET) imaging in Alzheimer's disease (AD) diagnosis has been well established. Recently, measurement of cerebral blood flow using arterial spin labeling magnetic resonance imaging (ASL-MRI) has shown diagnostic potential in AD, although it has never been directly compared with FDG-PET.
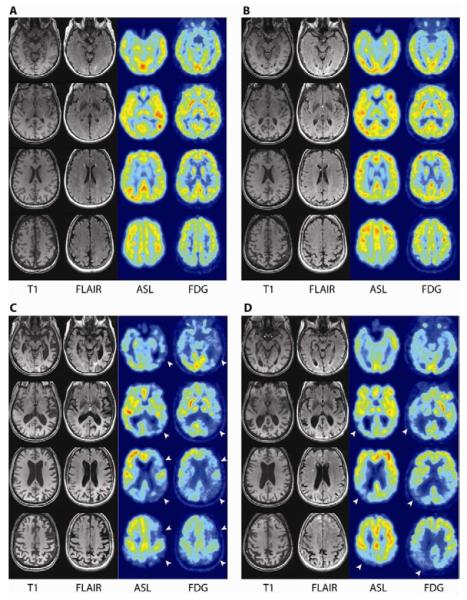
Methods: We used a novel imaging protocol to obtain FDG-PET and ASL-MRI images concurrently in 17 AD patients and 19 age-matched control subjects. Paired FDG-PET and ASL-MRI images from 19 control subjects and 15 AD patients were included for qualitative analysis, and paired images from 18 control subjects and 13 AD patients were suitable for quantitative analyses.
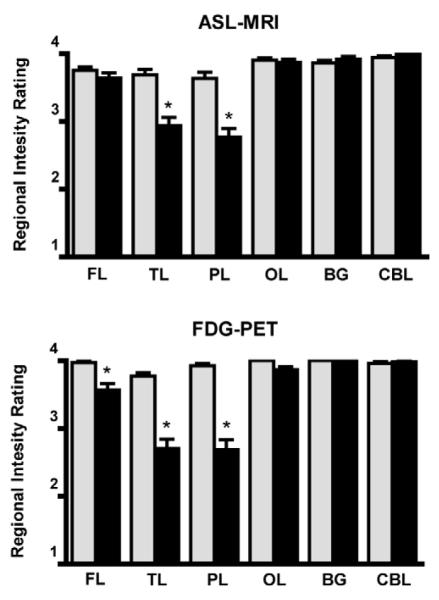
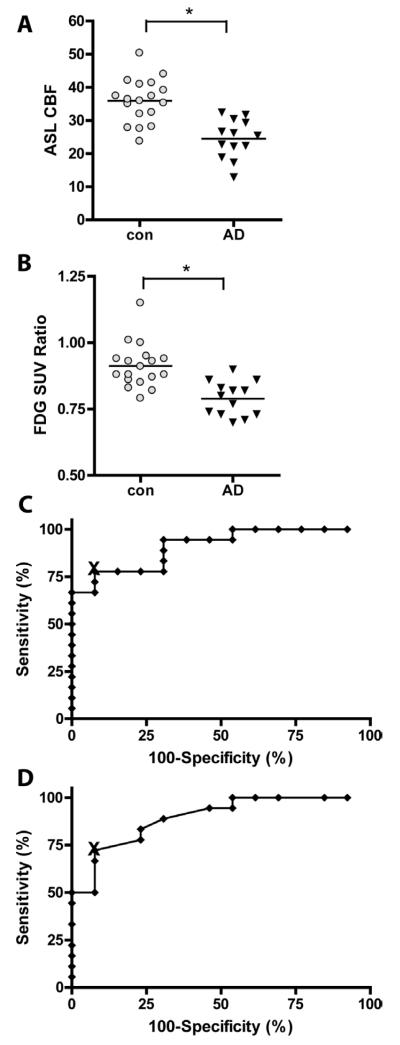
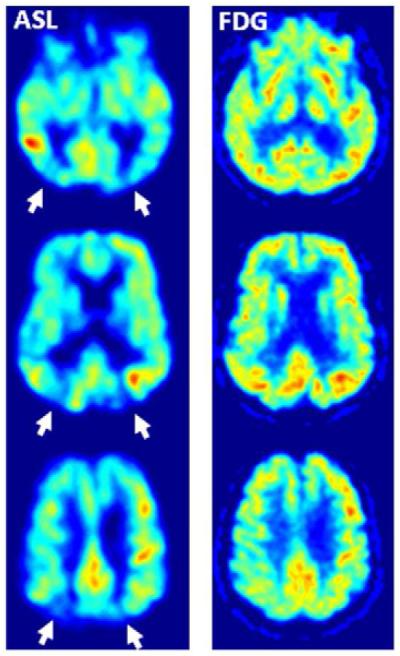
Results: The combined imaging protocol was well tolerated. Both modalities revealed similar regional abnormalities in AD, as well as comparable sensitivity and specificity for the detection of AD after visual review by two expert readers. Interobserver agreement was better for FDG-PET (κ: 0.75, standard error: 0.12) than ASL-MRI (κ: 0.51, standard error: 0.15); intermodality agreement was moderate to strong (κ: 0.45-0.61); and readers were more confident of FDG-PET reads. Simple quantitative analysis of global cerebral fluorodeoxyglucose uptake (FDG-PET) or whole-brain cerebral blood flow (ASL-MRI) showed excellent diagnostic accuracy for both modalities, with area under receiver operating characteristic curves of 0.90 for FDG-PET (95% confidence interval: 0.79-0.99) and 0.91 for ASL-MRI (95% confidence interval: 0.80-1.00).
Conclusions: Our results demonstrate that FDG-PET and ASL-MRI identify similar regional abnormalities and have comparable diagnostic accuracy in a small population of AD patients, and support the further study of ASL-MRI in dementia diagnosis.
Copyright © 2012 The Alzheimer's Association. Published by Elsevier Inc. All rights reserved.
Figures
Comment in
-
Alzheimer disease: Arterial spin-labeled MRI for diagnosis and monitoring of AD.Nat Rev Neurol. 2011 Dec 26;8(1):3. doi: 10.1038/nrneurol.2011.206. Nat Rev Neurol. 2011. PMID: 22198394 No abstract available.
References
-
- Fazekas F, Alavi A, Chawluk JB, Zimmerman RA, Hackney D, Bilaniuk L, et al. Comparison of CT, MR, and PET in Alzheimer’s dementia and normal aging. J Nucl Med. 1989;30:1607–1615. - PubMed
-
- Silverman DH, Small GW, Chang CY, Lu CS, Kung De, Aburto MA, Chen W, et al. Positron emission tomography in evaluation of dementia: Regional brain metabolism and long-term outcome. JAMA. 2001;286:2120–2127. - PubMed
-
- Hoffman JM, Welsh-Bohmer KA, Hanson M, Crain B, Hulette C, Earl N, et al. FDG PET imaging in patients with pathologically verified dementia. J Nucl Med. 2000;41:1920–1928. - PubMed
-
- Detre JA, Leigh JS, Williams DS, Koretsky AP. Perfusion imaging. Magn Reson Med. 1992;23:37–45. - PubMed
Publication types
MeSH terms
Substances
Grants and funding
LinkOut - more resources
Full Text Sources
Medical
