. 2011 Dec;37(4):328-41.
doi: 10.1016/j.jaut.2011.09.005. Epub 2011 Oct 22.

Tolerogen-induced interferon-producing killer dendritic cells (IKDCs) protect against EAE

Affiliations

Tolerogen-induced interferon-producing killer dendritic cells (IKDCs) protect against EAE

Eduardo Huarte et al. J Autoimmun. 2011 Dec.

Abstract

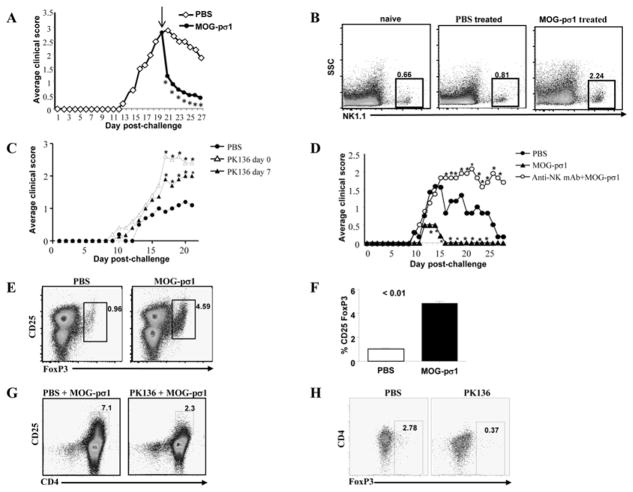
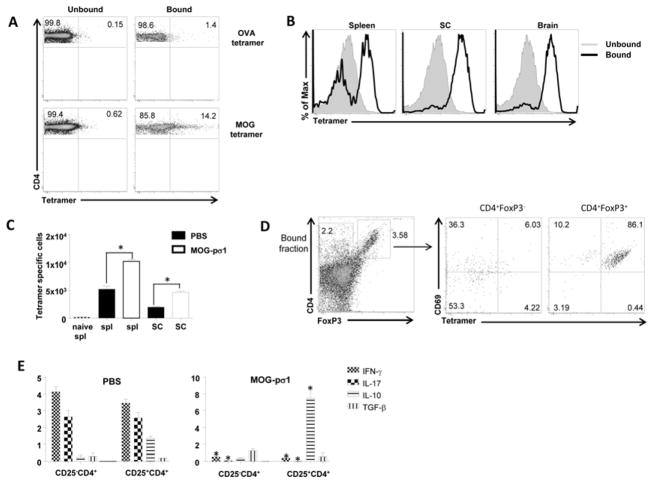
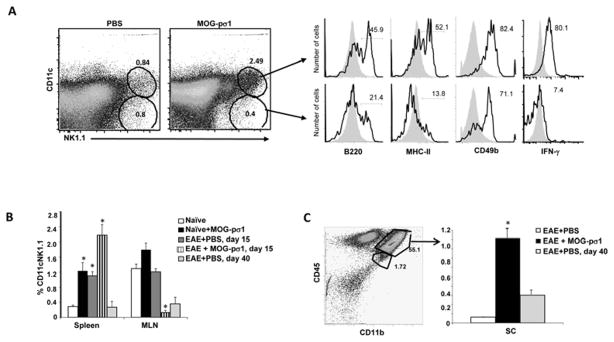
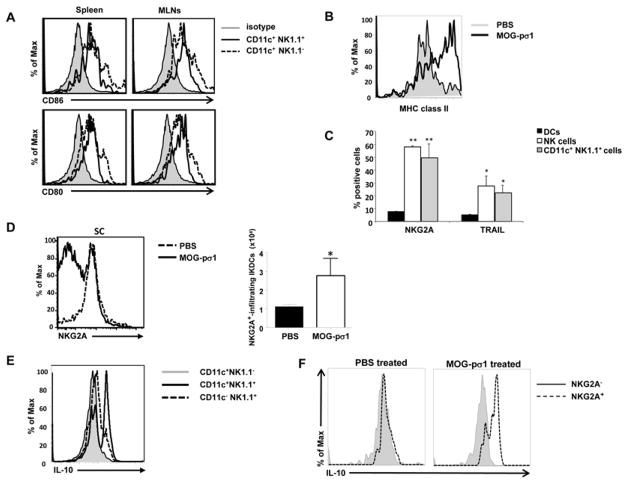
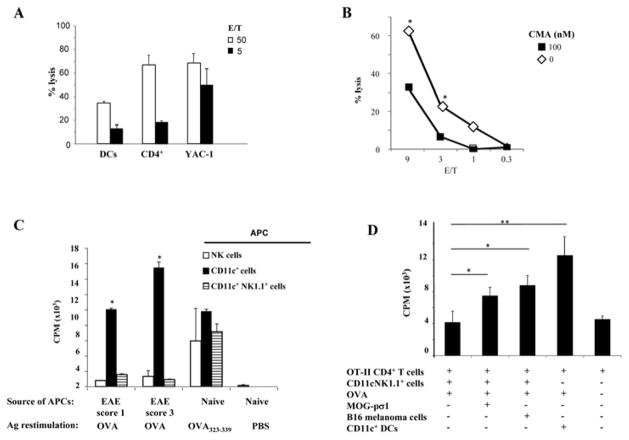
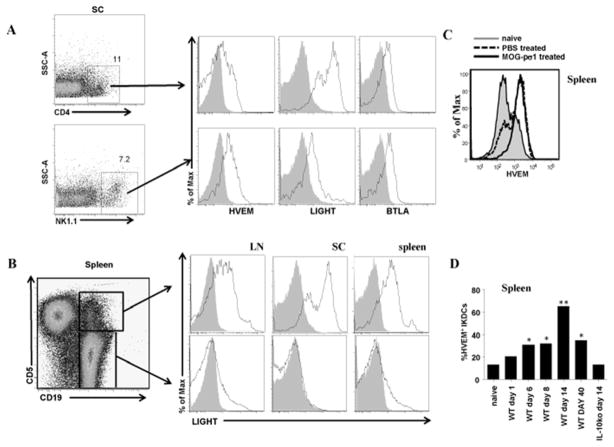
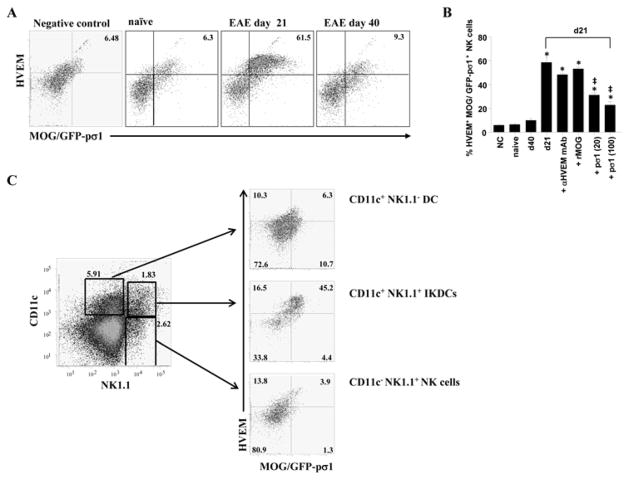
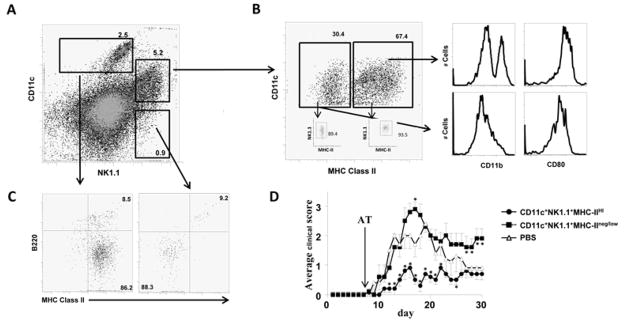
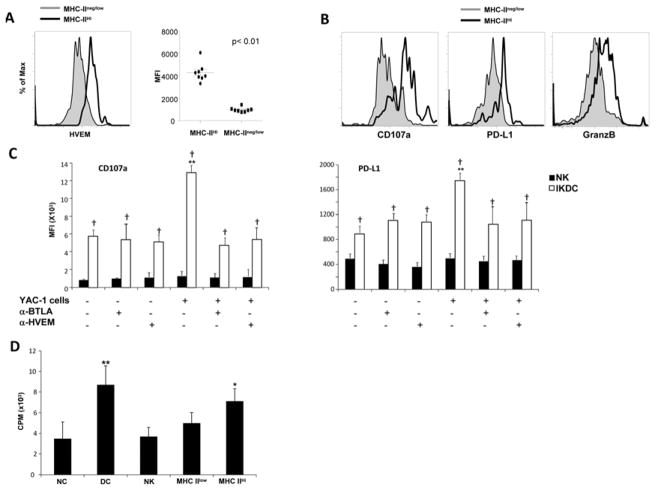
Natural killer (NK) cells and dendritic cells (DCs) have been shown to link the innate and adaptive immune systems. Likewise, a new innate cell subset, interferon-producing killer DCs (IKDCs), shares phenotypic and functional characteristics with both DCs and NK cells. Here, we show IKDCs play an essential role in the resolution of experimental autoimmune encephalomyelitis (EAE) upon treatment with the tolerizing agent, myelin oligodendrocyte glycoprotein (MOG), genetically fused to reovirus protein σ1 (termed MOG-pσ1). Activated IKDCs were recruited subsequent MOG-pσ1 treatment of EAE, and disease resolution was abated upon NK1.1 cell depletion. These IKDCs were able to kill activated CD4(+) T cells and mature dendritic DCs, thus, contributing to EAE remission. In addition, IKDCs were responsible for MOG-pσ1-mediated MOG-specific regulatory T cell recruitment to the CNS. The IKDCs induced by MOG-pσ1 expressed elevated levels of HVEM for interactions with cognate ligand-positive cells: LIGHT(+) NK and T(eff) cells and BTLA(+) B cells. Further characterization revealed these activated IKDCs being MHC class II(high), and upon their adoptive transfer (CD11c(+)NK1.1(+)MHC class II(high)), IKDCs, but not CD11c(+)NK1.1(+)MHC class II(intermediate/low) (unactivated) cells, conferred protection against EAE. These activated IKDCs showed enhanced CD107a, PD-L1, and granzyme B expression and could present OVA, unlike unactivated IKDCs. Thus, these results demonstrate the interventional potency induced HVEM(+) IKDCs to resolve autoimmune disease.


Conflict of interest statement

Conflict of interest

The authors have no financial conflict of interest.

Figures

Fig. 1
Fig. 1
MOG-pσ1 reduces EAE by recruiting Treg cells in a NK1.1+ cell-dependent fashion. A. C57BL/6 mice were orally treated with 50 μg of MOG-pσ1 or with PBS 20 days after MOG35–55-induced EAE. MOG-pσ1-treated mice showed improved resolution of clinical disease 24 h after treatment. The average score of 5 mice per group is depicted. *P < 0.05 versus PBS-treated group. A representative experiment of 8 is shown. B. Naïve C57BL/6 mice (left) or those induced with EAE were treated 18 days later with PBS (center) or 50 μg of MOG-pσ1 (right), and the percentage of NK1.1 cells in the spleens was evaluated 24 h later. C. C57BL/6 mice were treated weekly with PK136 depleting mAb starting at the time of EAE induction or 7 days later and monitored for disease course. D. C57BL/6 mice, either depleted or not of NK1.1+ cells by PK136 mAb treatment, were then orally dosed with MOG-pσ1 or PBS at the time of EAE induction, and monitored for disease course: *P < 0.05 versus PBS. E and F. EAE was induced in GFP-FoxP3 reporter mice and 18 days later orally dosed with 50 μg of MOG-pσ1 or PBS. Twenty-four hours later, mice were sacrificed, and spleens were removed and cultured for 4 days in the presence of MOG35–55 and feeder cells before being analyzed by flow cytometry. F. The average percentage of splenic FoxP3+ CD25+CD4+ T cells is shown after treatment with PBS (open bar) or MOG-pσ1 (black bar). G. LNs from C57BL/6 mice with EAE, depleted of NK1.1 cells (right panel), or not (left panel), were stained for CD4 and CD25 24 h after treatment with MOG-pσ1. The number of CD25+CD4+ T cells is shown. H. Evaluation of FoxP3 expression by CNS-infiltrating BM-derived cells from GFP-FoxP3 reporter mice with EAE treated with PBS (left panel) or PK136 mAb (right panel) is shown.
Fig. 2
Fig. 2
MOG-pσ1 treatment increases the number of MOG-specific Treg cells. A. Splenocytes from C57BL/6 EAE mice were incubated with APC-OVA329–337 (upper panels) or MOG42–55 tetramer (lower panels) and then reacted with magnetic anti-APC-beads. Magnetically bound (right panels) and unbound cell fractions (left panels) were then stained for CD4, CD11b, and CD45. A representative experiment of 3 is shown. B. Spleens and CNS-infiltrating lymphocytes from GFP-FoxP3 reporter mice were isolated, stained with APC-MOG tetramer, and again divided into bound and unbound cell fractions. Histograms representing tetramer staining for both fractions are shown. C. Absolute number of MOG-specific Treg cells in the bound fraction of indicated groups is shown. *P < 0.05 versus PBS-treated mice. D. SC-infiltrating lymphocytes were purified from GFP-FoxP3 EAE mice and separated into MOG-tetramer bound and unbound fractions. Cells were then stained for CD4, CD11b, CD45, and CD69, and the percentage of CD69+ tetramer-specific cells is shown for FoxP3+CD4+ and FoxP3CD4+ T cells in the bound fraction. E. CD25+CD4+ and CD25CD4+ T cells were purified from PBS- or MOG-pσ1-treated mice 15 days after EAE induction, and were restimulated in vitro with MOG35–55 in the presence of irradiated APCs. Cytokine levels (mean ∀ SEM from triplicate cultures) in culture supernatants were measured by cytokine-specific ELISAs 4 days after culture, and values are corrected for cytokine levels produced by unstimulated cells. *P < 0.05 versus PBS-treated mice.
Fig. 3
Fig. 3
MOG-pσ1 increases the infiltration of CD11c+NK1.1+ IKDCs. A. Lymphocytes from PBS- or MOG-pσ1-treated EAE mice were isolated, restimulated with MOG35–55, and stained for expression of NK1.1, CD11c, MHC class II, B220, CD49b, and intracellular IFN-γ. *P < 0.05 versus PBS-treated mice. A representative experiment of three is depicted. B. Percentages of CD11c+NK1.1+ cells in spleens and MLNs of PBS- or MOG-pσ1-treated PBS-treated or EAE mice (3–5/group) are shown. Mice recovering from EAE (day 40) are also included. C. PBS- or MOG-pσ1-treated mice, as well as recovering mice (day 40 p.ch), and CD45Hi CD11b+ BM-derived cells were evaluated for percentage of CD11c+NK1.1+ cells infiltrating the spinal cord (SC). *P < 0.05 versus PBS-treated mice. A representative experiment of three is depicted.
Fig. 4
Fig. 4
CD11c+NK1.1+ cells are phenotypically IKDCs, and the level of NKG2A decreases after MOG-pσ1 treatment. C57BL/6 mice were treated with MOG-pσ1 or PBS 20 days after induction of EAE, and 24 h later lymphocytes from spinal cord (SC), spleens, and LNs were purified and stained for analysis by flow cytometry. A. CD80 and CD86 staining was shown for DCs and CD11c+NK1.1+ cells in spleens (left panels) and MLNs (right panels); staining with an isotype control mAb is also shown (filled histogram). B. Levels of expression of MHC class II by SC-infiltrating CD11c+NK1.1+ cells are shown for PBS- and MOG-pσ1-treated mice. C. Percentages of NKG2A+ and TRAIL+ NK cells, DCs, and CD11c+NK1.1+ cells obtained from spleens of EAE mice are shown. *P < 0.05, **P < 0.010 versus DCs. D. NKG2A expression is reduced in SC-infiltrating NK1.1+ cells following MOG-pσ1 treatment (data depicted are representative of 5 mice/group), but absolute number of CNS-infiltrating NKG2A+ IKDCs is overall enhanced. *P < 0.05 versus PBS-treated mice. E. At the peak of disease, intracellular IL-10 staining was analyzed for CD11c+NK1.1, CD11c+NK1.1+, and CD11cNK1.1+ subsets. F. IL-10 is predominantly produced by NKG2A+ IKDC subset induced by MOG-pσ1 treatment. Data are of 3 mice/group.
Fig. 5
Fig. 5
CD11c+NK1.1+ cells are functionally IKDCs and able to kill CD4+ T cells and DCs and stimulate the proliferation of OT-II cells. A. Splenic and LN CD11c+NK1.1+ cells from EAE mice were cell-sorted and cultured for 3 days in the presence of IL-2 before performing a 51Cr release assay against autologous CD3/CD28 activated CD4+ T cells, bone marrow-derived DCs, or YAC-1 cells at the indicated effector: target (E/T) ratios. B. 51Cr release assay using CD11c+NK1.1+ effector cells against YAC-1 target cells in the presence of concanamycin A (CMA) or control media was performed at various E/T ratios. *P ≤ 0.05 versus CMA. C. DCs and NK cells, as well as CD11c+NK1.1+ cells, were cell-sorted from splenocytes obtained from C57BL/6 mice 10 or 20 days (clinical scores 1 and 3, respectively) after EAE induction and co-cultured with OT-II CD4+ T cells and OVA protein. As positive control, NK cells, DCs, and CD11c+NK1.1+ cells from naive mice were pulsed with OVA323–339 and compared to cultures stimulated in the absence of Ag. The mean of triplicate cultures ∀ SD is depicted and is representative from three experiments; *P < 0.05 depicts significant differences for OVA presentation by CD11c+ DCs versus CD11c+NK1.1+ cells. D. CD11c+NK1.1+ cells and DCs were cell-sorted from C57BL/6 mice at the peak of the disease and preincubated or not with B16F1 melanoma cells or MOG-pσ1 plus OVA protein before the co-culture with purified OT-II CD+ T cells. The mean of triplicate cultures ∀ SD representative of two experiments is shown; *P < 0.05, **P < 0.010 versus OVA-pulsed CD11c+NK1.1+ cells.
Fig. 6
Fig. 6
MOG-pσ1 treatment induces an up-regulation of HVEM in NK1.1+ cells. A. C57BL/6 mice were treated with MOG-pσ1 or PBS 20 days after EAE induction, and 24 h after treatment, spleens and SC cells were stained for CD4, NK1.1, HVEM, LIGHT, and BTLA. Percentages of infiltrating CD4+ T cells and IKDCs in the SC of PBS- or MOG-pσ1-treated mice are shown. Staining by an isotype control mAb is shown as filled histogram; * P ≤ 05. A representative experiment of three is depicted. B. EAE was induced in C57BL/6 mice, and 20 days later, splenic, LN, and SC lymphocytes were purified and analyzed by flow cytometry for CD5, CD19, HVEM, LIGHT, and BTLA expression. Gating strategy is shown on the left-hand side. Histograms and percentages of positive cells are shown on at the right-hand side. Staining by an isotype control mAb is shown as filled histogram. A representative mouse out of five is shown. C. A histogram depicts HVEM levels for splenic NK1.1+ cells from naïve and PBS- or MOG-pσ1-treated EAE mice. A representative experiment of three is shown. D. Percentages of splenic CD11c+NK1.1+ IKDCs expressing HVEM at different time points after EAE induction are shown. Percentages of HVEM+ IKDCs from IL-10−/− mice at day 14 after EAE induction are also shown. *P < 0.05, **P ≤ 0.01 versus naive mice.
Fig. 7
Fig. 7
HVEM+ IKDCs bind MOG-pσ1. A. Splenic and LN lymphocytes from naïve- or EAE- challenged mice 10 or 40 days earlier were tested for their ability to bind MOG/GFP-pσ1 following 4 days restimulation with MOG35–55 and IL-2. Negative control cells were stained with MOG-pσ1 instead of MOG/GFP-pσ1. Data depict cells gated on NK1.1+ cells (representative of four mice/group). B. Percentages of NK1.1 HVEM+ cells binding to MOG/GFP-pσ1 were assessed. Anti- HVEM mAb (20 μg/ml), recombinant MOG (20 μg/ml), or recombinant pσ1 (20 and 100 μg/ml) was added when indicated. Each column represents the mean ± SD from 4 mice/group. **P ≤ 0.01 versus negative control (NC); P < 0.01 versus d21 MOG/GPF-pσ1 staining. (C) Splenocytes from a mouse (representative of 3 mice) at the peak of the disease were gated on CD11c+ DCs, CD11c+NK1.1+ cells (IKDCs), and NK1.1+ CD11c NK cells and analyzed for MOG/GFP-pσ1 binding and HVEM expression.
Fig. 8
Fig. 8
Adoptive transfer of IKDCs protects against EAE. A. C57BL/6 mice were challenged with MOG and 15 days later treated with 50 μg of MOG-pσ1. Twenty-four hours later, mice were sacrificed, and their spleens and LNs were combined and stained with CD11c, NK1.1, MHC class II, and B220. CD11c+NK1.1+ cells were sorted based on their MHC class II expression. B. MHC class IIHi- and MHC class IIlow-sorted cells were analyzed for CD11b and CD80 expression. The purity of the sorting is shown on the inserted panels. C. CD11c+ DC and NK1.1+ cells were analyzed for B220 and MHC-class II expression. As expected, only CD11c+ cells expressed high levels of MHC class II. D. 1×10⁵ CD11c+NK1.1+MHC class IIhi cells (activated IKDCs) or CD11c+NK1.1+MHC class IIlow (unactivated) cells were adoptively transferred (AT) into C57BL/6 mice previously induced with EAE 7 days earlier and monitored for disease course. Average score of five mice is shown. *P < 0.05, **P < 0.010 versus PBS.
Fig. 9
Fig. 9
Activated IKDCs, but not NK cells, up-regulate HVEM, CD107a, and PDL-1. A. C57BL/6 mice were challenged with MOG, and 15 days later their splenocytes were analyzed for HVEM expression. Only CD11c+NK1.1+MHC class IIHi IKDCs, but not CD11c+NK1.1+MHC class intermediate/low cells, up-regulated HVEM expression. Left panel shows a representative histogram. Right panel shows the individual MFI values and the mean for 8 mice/group. B and C. IKDCs and NK cells were cultured in the presence or absence of YAC-1 cells and anti-BTLA and anti-HVEM mAbs, and CD107a, PD-L1, and granzyme B expression were measured by flow cytometry. YAC-1 cell co-culture increases CD107a degranulation and PD-L1 overexpression by IKDCs, and anti-BTLA or anti-HVEM mAb treatment blocks such up-regulation. **P ≤ 0.01 versus PBS-treated mice; P <0.01 versus NK cells. D. NK1.1+ CD11c, NK1.1 CD11c+, NK1.1+ CD11c+ MHC class IIHi, and NK1.1+ CD11c+ MHC class IIintermediate/low cells (2×10⁴) were pulsed with OVA overnight and then co-cultured with 1×10⁵ OT-II CD4+ T cells, and 3H-thymidine incorporation was measured after 3 days of culture. *P < 0.05, **P ≤ 0.01 versus negative control (NC) group (without Ag-presenting cells).

Similar articles

Cited by

References

    1. Flodstrom-Tullberg M, Bryceson YT, Shi FD, Hoglund P, Ljunggren HG. Natural killer cells in human autoimmunity. Curr Opin Immunol. 2009;21:634–40. - PubMed
    1. Paust S, Senman B, von Andrian UH. Adaptive immune responses mediated by natural killer cells. Immunol Rev. 2010;235:286–96. - PMC - PubMed
    1. Rabinovich BA, Shannon J, Su RC, Miller RG. Stress renders T cell blasts sensitive to killing by activated syngeneic NK cells. J Immunol. 2000;165:2390–7. - PubMed
    1. Marcenaro E, Della Chiesa M, Bellora F, Parolini S, Millo R, Moretta L, et al. IL-12 or IL-4 prime human NK cells to mediate functionally divergent interactions with dendritic cells or tumors. J Immunol. 2005;174:3992–8. - PubMed
    1. Homann D, Jahreis A, Wolfe T, Hughes A, Coon B, van Stipdonk MJ, et al. CD40L blockade prevents autoimmune diabetes by induction of bitypic NK/DC regulatory cells. Immunity. 2002;16:403–15. - PubMed

Publication types

MeSH terms

Substances