. 2012 Mar 1;363(1):201-18.
doi: 10.1016/j.ydbio.2011.10.003. Epub 2011 Oct 8.

STELLA-positive subregions of the primitive streak contribute to posterior tissues of the mouse gastrula

Affiliations

STELLA-positive subregions of the primitive streak contribute to posterior tissues of the mouse gastrula

Maria M Mikedis et al. Dev Biol. .

Erratum in

  • Dev Biol. 2012 Jun 15;366(2):435

Abstract

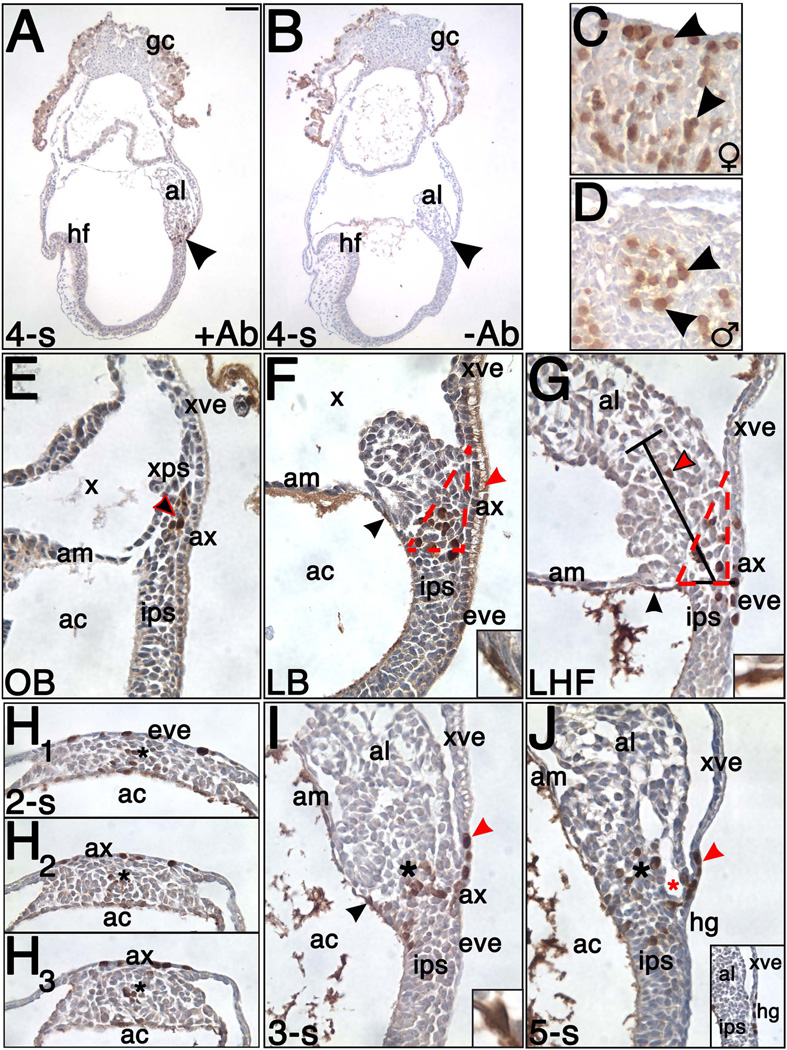
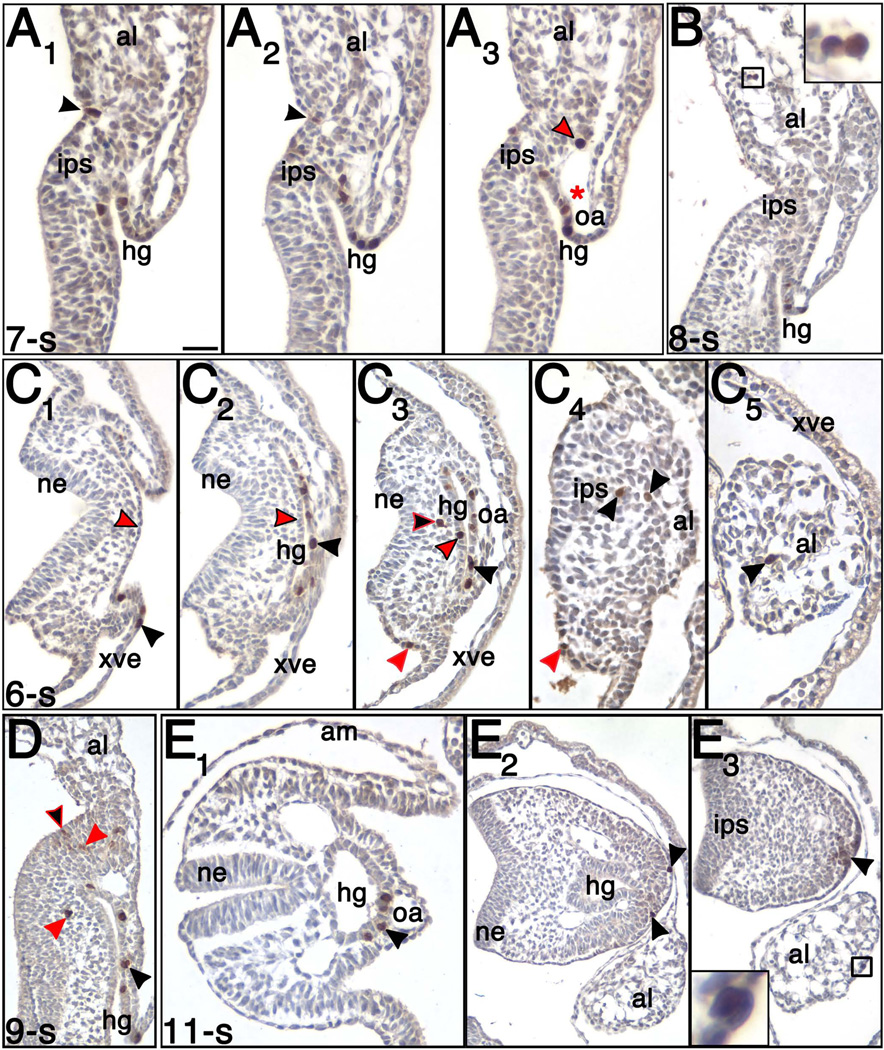
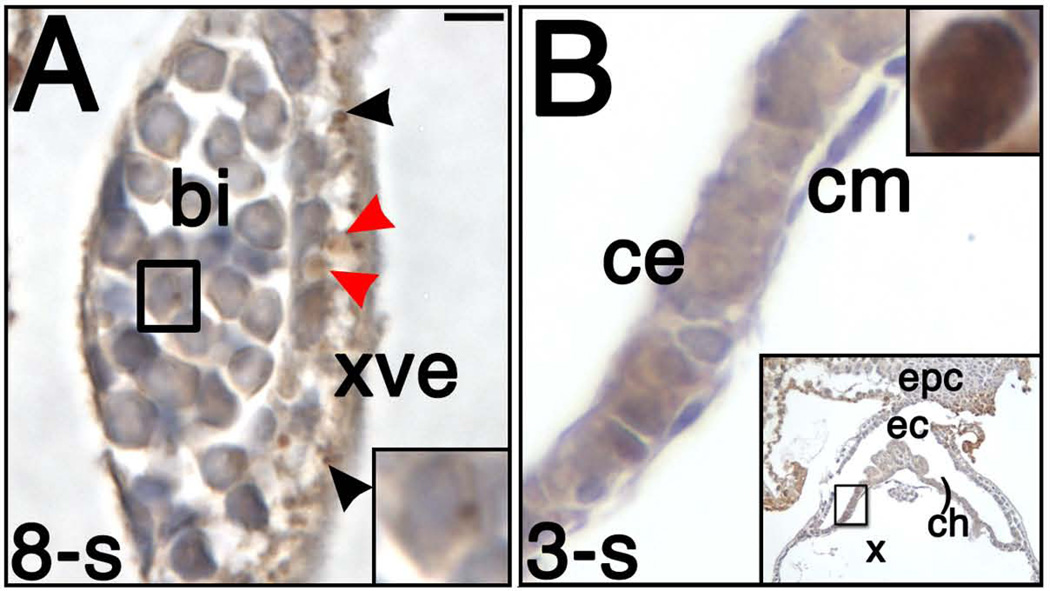
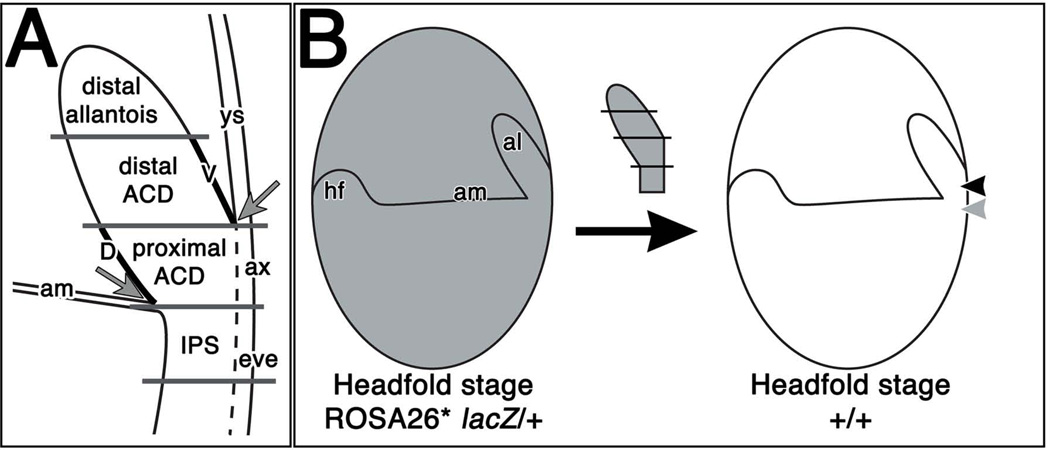
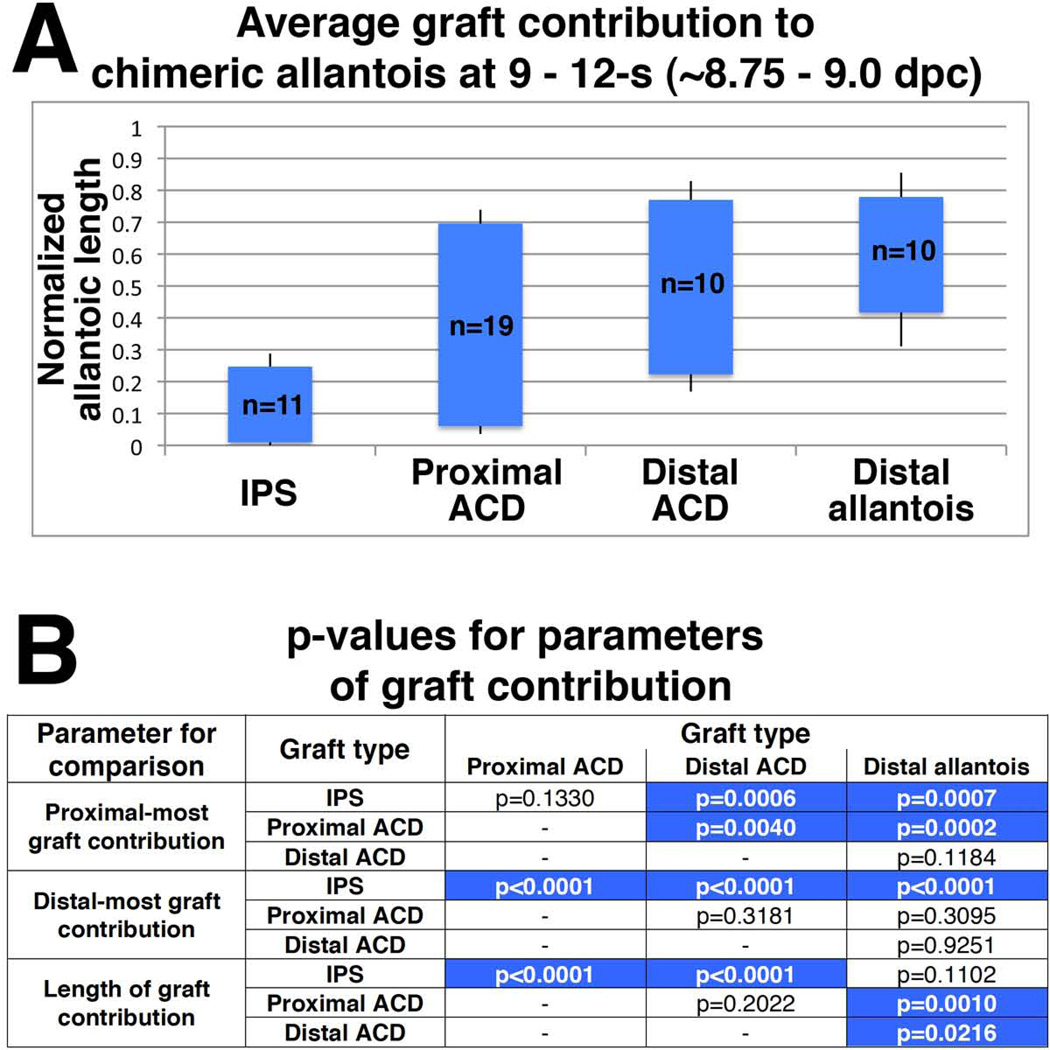
The developmental relationship between the posterior embryonic and extraembryonic regions of the mammalian gastrula is poorly understood. Although many different cell types are deployed within this region, only the primordial germ cells (PGCs) have been closely studied. Recent evidence has suggested that the allantois, within which the PGCs temporarily take up residence, contains a pool of cells, called the Allantoic Core Domain (ACD), critical for allantoic elongation to the chorion. Here, we have asked whether the STELLA-positive cells found within this region, thought to be specified PGCs, are actually part of the ACD and to what extent they, and other ACD cells, contribute to the allantois and fetal tissues. To address these hypotheses, STELLA was immunolocalized to the mouse gastrula between Early Streak (ES) and 12-somite pair (-s) stages (~6.75-9.0 days post coitum, dpc) in histological sections. STELLA was found in both the nucleus and cytoplasm in a variety of cell types, both within and outside of the putative PGC trajectory. Fate-mapping the headfold-stage (~7.75-8.0 dpc) posterior region, by which time PGCs are thought to be segregated into a distinct lineage, revealed that the STELLA-positive proximal ACD and intraembryonic posterior primitive streak (IPS) contributed to a wide range of somatic tissues that encompassed derivatives of the three primary germ layers. This contribution included STELLA-positive cells localizing to tissues both within and outside of the putative PGC trajectory. Thus, while STELLA may identify a subpopulation of cells destined for the PGC lineage, our findings reveal that it may be part of a broader niche that encompasses the ACD and through which the STELLA population may contribute cells to a wide variety of posterior tissues of the mouse gastrula.


Figures

Figure 1
Figure 1. Antibody specificity and STELLA in the posterior region during the early stages of allantoic development (Neural Plate/No Allantoic Bud (OB) – 5-s; ~7.0 – 8.25 dpc)
Unless otherwise indicated, all sections presented here and in subsequent figures are sagittal with anterior on the left and posterior on the right. STELLA is brown; unless otherwise noted, sections were counterstained in hematoxylin (blue color). (A) Staining with anti-STELLA (+Ab), 4-s stage. Arrowhead indicates STELLA-positive cells in the base of the allantois (al) and surrounding region. (B) Minus antibody control (−Ab), 4-s stage. Arrowhead indicates loss of STELLA in the allantois and surrounding region and thus, antibody specificity. Staining in the trophoblast giant cells (gc) and associated parietal endoderm may be spurious, and due to permeability associated with cell death during dissections. (C–D) Gonads, 12.5 dpc. Anti-STELLA detected exemplary germ cells (arrowheads) in developing female (♀; C) and male (♂; D) gonads. (E) Neural Plate/No Allantoic Bud (OB) stage (~7.0 dpc). A cluster of STELLA-positive cells (black arrowhead outlined in red) localized to the XPS (extraembryonic primitive streak, xps). (F) Late Bud (LB) stage (~7.5 dpc). A cluster of STELLA-positive cells expanded within the XPS (outlined by red dotted line) and into the IPS (intraembryonic primitive streak, ips). STELLA-positive cells in amniotic ectoderm (black arrowhead; higher magnification in inset) were occasionally observed at this stage. STELLA-positive vesicle in AX (allantois-associated extraembryonic visceral endoderm; ax) denoted by red arrowhead. (G) Late Headfold (LHF) stage (~8.0 dpc). A cluster of STELLA-positive cells localized to the proximal region of the ACD (outlined by red dotted line) as well as to the IPS, AX, and EVE (embryonic visceral endoderm, eve) overlying the IPS. Red arrowhead outlined in black marks the rare STELLA-positive cells that localized to a more distal region of the Allantoic Core Domain, or ACD, delineated by brackets, representing average length of 120 µm (Downs et al., 2009). STELLA-positive cell in amniotic ectoderm denoted by black arrowhead and displayed at higher magnification in inset. (H1–3) 2-s stage (~8.25 dpc), transverse profile with ventral toward the top and dorsal toward the bottom of each panel. Sections represent: the IPS 18 µm below allantois (H1), the base of the allantois at the embryonic/extraembryonic boundary (H2), and 18 µm above the base of the allantois (H3). Asterisk denotes approximate center of the IPS or ACD in each section. STELLA localization was dispersed across the dorsal-ventral axis of the posterior embryo (H1) but most STELLA-positive cells were centrally confined within the ACD (H2–3). STELLA-positive cells also localized to the EVE (H1) and AX (H2–3). (I–J) 3-s and 5-s stages (~8.25 dpc). STELLA-positive cells persisted in the ACD (black asterisk), IPS, EVE, and AX (I) as well as the hindgut (hg; J inset). Additional STELLA-positive cells localized to the ventral cuboidal mesothelium (VCM)-associated extraembryonic visceral endoderm (xve; red arrowhead). STELLA-positive cell in amniotic ectoderm denoted by black arrowhead and displayed at higher magnification in inset (I). Red asterisk (J) marks vessel of confluence. Other abbreviations: ac, amniotic cavity; am, amnion; hf, headfolds; x, exocoelomic cavity. Scale bar in A = 200.0 µm (A–B), 26.7 µm (C–D), 24.8 µm (E–G, I, J), 8.3 µm (F inset), 8.4 µm (G inset), 34.2 µm (H1–3), 7.3 µm (I inset), 56.5 (J inset).
Figure 2
Figure 2. STELLA during early hindgut tube formation (6 – 12-s; ~8.5 – 9.0 dpc)
(A1–3) 7-s stage (~8.5 dpc). STELLA-positive cells localized to the dorsal (A1) and ventral (A1–3) hindgut as well as at the site of amniotic insertion at the embryonic-extraembryonic junction (black arrowheads in A1–2), IPS (A2–3), and near the vessel of confluence in the allantois (red arrowhead outlined in black, A3). Red asterisk marks vessel of confluence. (B) 8-s stage (~8.75 dpc). A cluster of STELLA-positive cells localizing to the midregion of the allantois (box; higher magnification in inset). (C1–5) 6-s stage (~8.5 dpc), transverse profile with dorsal to the left and ventral to the right of each panel. This sequence begins at the hindgut opening and proceeds posteriorly toward the allantois. (C1) 18 µm below the anterior-most segment of closed hindgut tube. STELLA-positive cells (black arrowhead) localized to the endoderm at the leading edge of the open hindgut. Note absence of STELLA-positive cells in presumptive dorsal hindgut endoderm (red arrowhead outlined in black). (C2) Anterior-most segment of closed hindgut tube. STELLA-positive cells localized to the ventral (black arrowhead), but not dorsal, side (red arrowhead outlined in black). (C3) More posteriorly (24 µm posterior to the anterior-most segment of the closed hindgut tube, and 36 µm anterior to the end of the hindgut tube), STELLA-positive cells primarily localized to the ventral hindgut (black arrowhead), but some also localized to the dorsal hindgut (red arrowhead outlined in black). In addition, STELLA-positive cells also localized to the posterior mesenchyme (black arrowhead outlined in red) and posterior dorsal surface ectoderm (red arrowhead). (C4) 12 µm posterior to the end of the hindgut tube. STELLA-positive cells localized outside of the hindgut to surface ectoderm (red arrowhead) and in the IPS near the allantois (black arrowhead). (C5) 132 µm and 144 µm posterior to base of the allantois and the end of the hindgut, respectively. STELLA-positive cell (black arrow) in the allantois. (D) 9-s stage (~8.75 dpc). STELLA localization in the ventral hindgut (black arrowhead), posterior loose mesenchyme (red arrowheads), and surface ectoderm (black arrowhead stroked in red). (E1–3) 11-s stage (~9.0 dpc), transverse profile. The tail has turned, and the allantois has shifted its position to lie in the posterior ventral midline. These sections were taken at the level of the closed hindgut tube anterior (E1) and posterior (E2–3) to the allantoic insertion into the tailbud. (E1) STELLA-positive cells (black arrowhead) localize to the ventral hindgut. (E2) STELLA-positive cells (black arrowheads) localize near the surface ectoderm of the tailbud, 18 µm below the posterior end of hindgut. (E3) Anti-STELLA reactivity (black arrow) in the ventral ectoderm ridge of the posterior embryo, 12 µm above the end of the posterior hindgut. STELLA also localized to the allantois (box; higher magnification in inset), 60 µm from the site of posterior allantoic attachment to the embryo. Other abbreviations: ne, neurectoderm; oa, omphalomesenteric artery. Scale bar in A1 = 27.3 µm (A1–3), 35.7 µm (B), 9.0 µm (B inset), 37.8 µm (C1–3), 26.1 µm (C4), 25.1 µm (C5), 42.3 µm (D), 30.6 µm (E1), 55.3 µm (E2–3), 8.3 µm (E3 inset).
Figure 3
Figure 3. STELLA localization in the extraembryonic visceral yolk sac and chorionic ectoderm
(A) 8-s stage (~8.75 dpc), visceral yolk sac blood islands (bi). A single hematopoietic cell (outlined with black box; higher magnification in lower right inset) with a cytoplasmic dot of STELLA staining within a yolk sac blood island. Dark, dense STELLA (black arrowheads) and larger, transparent-looking STELLA (red arrowheads) localized within yolk sac endodermal vesicles. (B) 3-s stage (~8.25 dpc), chorionic ectoderm (ce). Chorionic ectoderm, from portion of chorion (ch) highlighted in lower right inset, contains diffuse STELLA, and ambiguous nuclear staining (compare chorionic ectoderm staining with robust STELLA-positive nucleus from AX within the same specimen, upper right inset). Other abbreviations: cm, chorionic mesoderm; ec, ectoplacental cavity; epc, ectoplacental cone. Scale bar in A = 7.2 µm (A), 3.0 µm (A inset), 8.3 µm (B), 3.6 µm (B upper right inset), 100.0 µm (B lower right inset).
Figure 4
Figure 4. Fate-mapping the posterior region via synchronous orthotopic grafting
(A) The headfold-stage posterior region was divided into four subregions: distal allantois, distal ACD, proximal ACD, and IPS. Site of insertion of amnion (am) was used to separate the (extraembryonic) allantoic tissue from embryonic tissue. Site of insertion of the allantois (al) into the visceral yolk sac (ys) was used to define the boundary between proximal and distal ACD. Overlying allantois-associated extraembryonic visceral endoderm (ax) and embryonic visceral endoderm (eve), both of which are delineated by the dotted line, were removed from the proximal ACD and IPS, respectively. The proximal ACD contained the dorsal cuboidal mesothelium (D), and the distal ACD contained the ventral cuboidal mesothelium (V). (B) Donor posterior regions from headfold-stage ROSA26* lacZ/+ hemizygous donor conceptuses were removed and isolated into four subregions (see Fig. 1A). Each subregion was transplanted into the posterior region of a headfold stage, non-transgenic host. Allantoic subregions and the IPS were grafted into the host’s proximal ACD (black arrowhead) and IPS (gray arrowhead), respectively.
Figure 5
Figure 5. Proximal ACD and IPS contribute STELLA-positive and STELLA-negative cells to the posterior conceptus (9 – 12-s; ~8.75 – 9.0 dpc)
All sections are transverse profiles with ventral on the right and dorsal on the left of each panel. (A) 10-s. Proximal ACD graft contributed to splanchnopleure (red arrow), endothelium of the vessel of confluence (voc; black arrowhead), posterior mesoderm (red arrowhead outlined in black), and circulating hematopoietic cell (black box; higher magnification within inset). Specimen counterstained with Nuclear Fast Red (pink color). (B1–2) 11-s. Proximal ACD graft contributed to endothelium of the omphalomesenteric artery (oa; B1–2, black arrowhead) as well as to STELLA-positive cells (B1, red box; higher magnification within inset) and STELLA-negative cells (B2, black arrowhead outlined in red) in the ventral hindgut. (C) 10-s. Proximal ACD graft contributed to the allantois, including STELLA-positive cells (red box, higher magnification within inset). (D) 11-s. IPS graft contributed to splanchnopleure (red arrow), somatopleure (black arrow), STELLA-positive cells (red box; higher magnification within inset) and STELLA-negative cells (black arrowhead outlined in red) within ventral hindgut, and posterior mesoderm (red arrowheads outlined in black). (E) 11-s. IPS graft contributed to STELLA-positive cells in ventral ectodermal ridge (red arrow) as well as endothelium of the vessel of confluence (black arrowhead). Lower magnification within inset. (F) 9-s. IPS graft contributed to posterior mesoderm, including STELLA-positive cells (red box, higher magnification within inset). (G) 9-s. IPS graft contributed to the allantois, including STELLA-positive cells (red box, higher magnification within inset). (H) 10-s. Host-derived double omphalomesenteric artery (red asterisks) in chimera that received IPS graft. Graft contribution occurred posterior to this section. (I) Comparison of total STELLA-positive population in ex vivo specimens, unoperated controls, and operated chimeras (host-derived STELLA-positive cells only) to proximal ACD-and IPS-derived STELLA-positive contribution at 9 – 12-s (~8.75 – 9.0 dpc). Only proximal ACD or IPS grafts that exhibited STELLA-positive contribution to a particular cell type were included in this analysis. No STELLA-positive cells were observed in the splanchnopleure. STELLA-positive populations in the allantois, hindgut, posterior mesoderm (loose mesenchyme and somatopleure-associated mesoderm), ventral ectodermal ridge, and surface ectoderm were similar in ex vivo specimens when compared to unoperated culture controls (p=0.9288, p=0.6011, p=0.8273, p=0.4614, and p=0.7344, respectively) and operated chimeras (p=0.4464, p=0.7466, p=0.1964, p=0.1994, and p=0.3748, respectively). In addition, STELLA-positive populations in these tissues were similar between unoperated culture controls and operated chimeras (p=0.5018, p=0.3632, p=0.2083, p=0.8396, and p=0.6055, respectively). Proximal ACD grafts contributed similar numbers of STELLA-positive cells to the allantois as found in ex vivo specimens (p=0.1208), unoperated controls (p=0.2174), and operated host chimeras (p=0.1617). IPS grafts contributed similar numbers of STELLA-positive cells to the allantois and posterior mesoderm as ex vivo specimens (p=0.1921 and p=0.7850, respectively), unoperated controls (p=0.2672 and p=0.6501), and operated host chimeras (p=0.1172 and p=0.5242). IPS grafts also contributed similar numbers of STELLA-positive cells to the ventral ectodermal ridge compared to ex vivo specimens (p=0.9456) and unoperated controls (p=0.1605), but more cells compared to operated chimeras (p=0.0305). Proximal ACD and IPS grafts contributed fewer STELLA-positive cells to the hindgut compared to ex vivo specimens (p=0.0011 and p<0.0001, respectively), unoperated controls (p=0.0055 and p<0.0001, respectively), and operated host chimeras (p<0.0001 for both graft types). All statistical calculations based on Student’s t-test at a 0.05 significance level. Error bars represent standard error of the mean (sem); number below each graph bar represents sample size (N). Other abbreviations: da, dorsal aortae. Scale bar in A = 33.3 µm (A), 7.5 µm (A inset), 34.4 µm (B1–2), 16.2 µm (B1 inset), 50.0 µm (C–E, G), 9.6 µm (C inset), 10.0 µm (D inset), 254.4 µm (E inset), 76.0 µm (F), 15.0 µm (F inset), 10.1 µm (G inset), 43.2 µm (H).
Figure 6
Figure 6. Graft contribution along length of allantois at 9 – 12-s (~8.75 – 9.0 dpc)
(A) Average graft contribution along normalized length of chimeric allantois, with 0 representing site of insertion into posterior embryo and 1 representing site of fusion with chorion. Error bars represent standard error of the mean (sem). (B) Analysis of proximal-most graft contribution, distal-most graft contribution, and total length of graft contribution via Student’s t-test. Statistically significant differences (p<0.05) highlighted in blue.

Similar articles

Cited by

References

    1. Anderson R, Copeland TK, Scholer H, Heasman J, Wylie C. The onset of germ cell migration in the mouse embryo. Mechanisms of Development. 2000;91:61–68. - PubMed
    1. Beddington RSP. An autoradiographic analysis of tissue potency in different regions of the embryonic ectoderm during gastrulation in the mouse. Journal of Embryology and Experimental Morphology. 1982;69:265–285. - PubMed
    1. Beddington RSP. Isolation, culture and manipulation of post-implantation mouse embryos. In: Monk M, editor. Mammalian Development: A Practical Approach. Oxford: IRL Press; 1987. pp. 43–69.
    1. Boisset JC, van Cappellen W, Andrieu-Soler C, Galjart N, Dzierzak E, Robin C. In vivo imaging of haematopoietic cells emerging from the mouse aortic endothelium. Nature. 2010;464:116–120. - PubMed
    1. Bortvin A, Goodheart M, Liao M, Page DC. Dppa3 / Pgc7 / stella is a maternal factor and is not required for germ cell specification in mice. BMC Developmental Biology. 2004;4:2. - PMC - PubMed

Publication types

MeSH terms

Substances

LinkOut - more resources