. 2011 Oct 23;17(11):1514-20.
doi: 10.1038/nm.2454.

Tumor grafts derived from women with breast cancer authentically reflect tumor pathology, growth, metastasis and disease outcomes

Affiliations

Tumor grafts derived from women with breast cancer authentically reflect tumor pathology, growth, metastasis and disease outcomes

Yoko S DeRose et al. Nat Med. .

Abstract

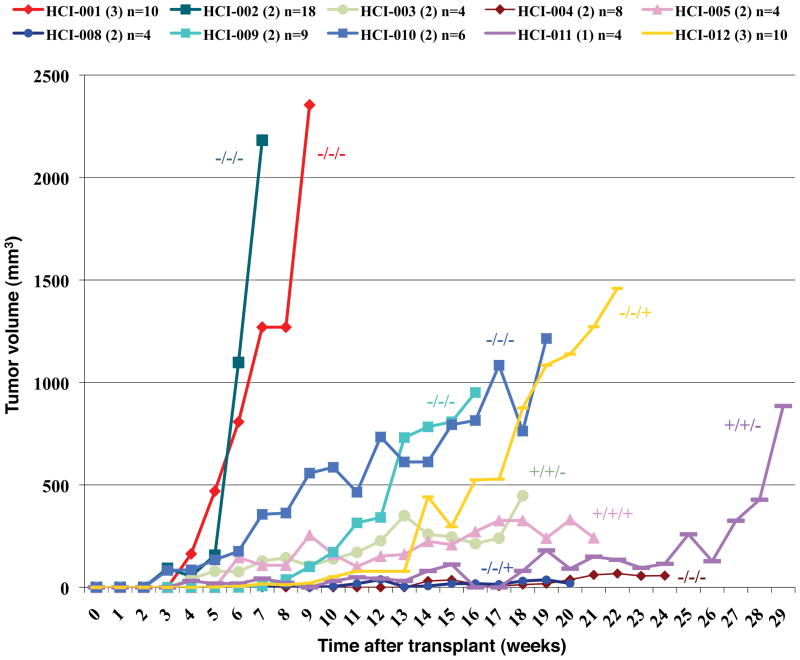
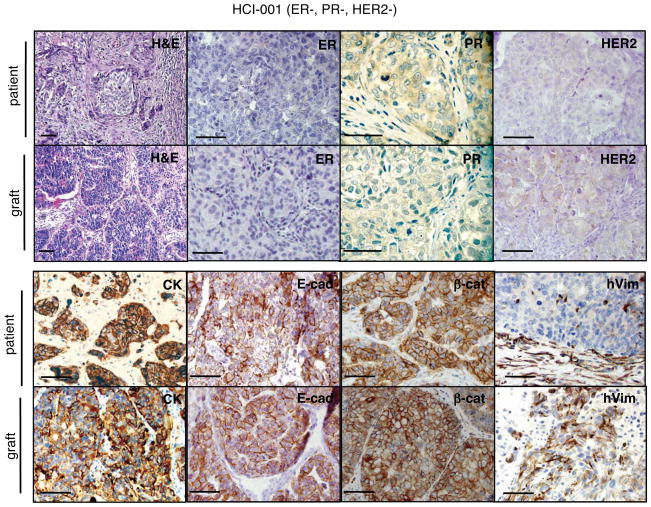
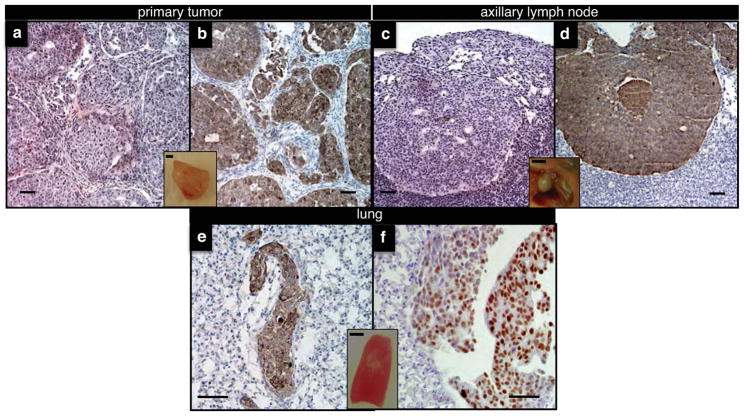
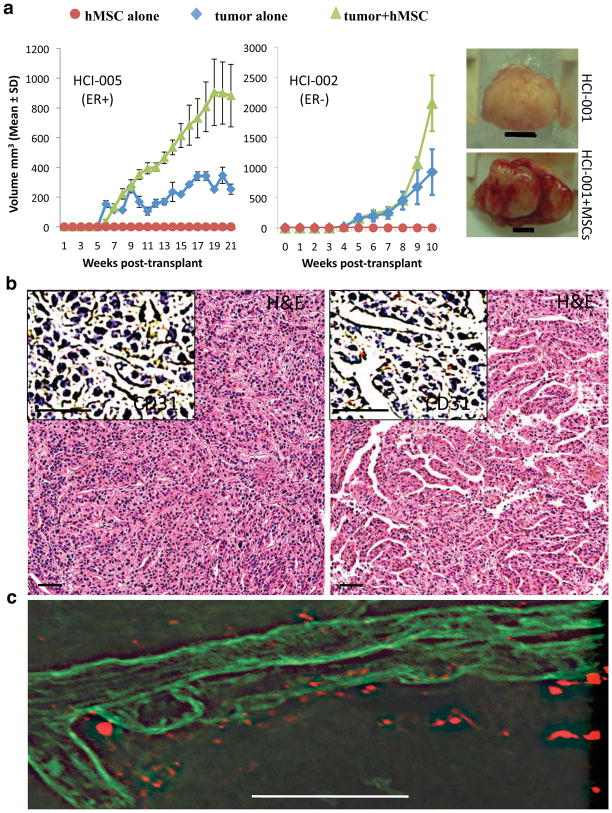
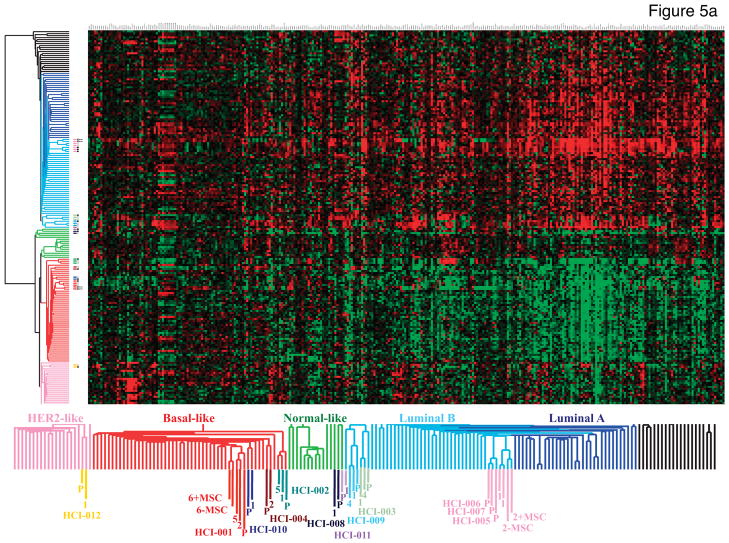
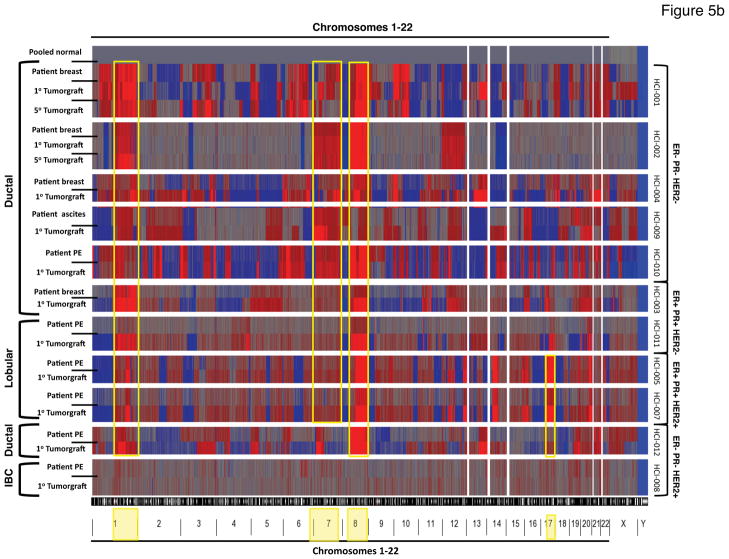
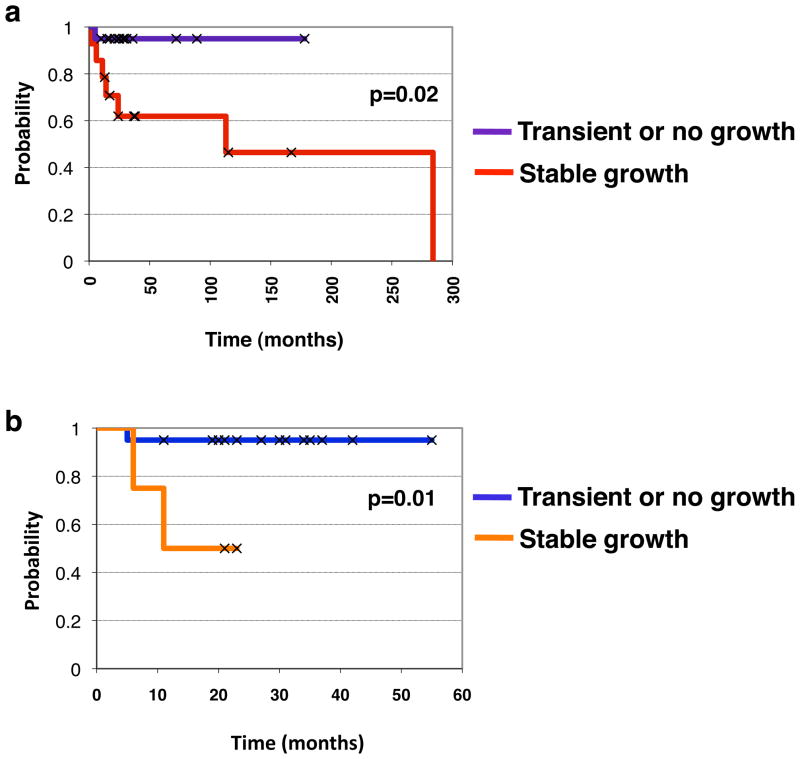
Development and preclinical testing of new cancer therapies is limited by the scarcity of in vivo models that authentically reproduce tumor growth and metastatic progression. We report new models for breast tumor growth and metastasis in the form of transplantable tumors derived directly from individuals undergoing treatment for breast cancer. These tumor grafts illustrate the diversity of human breast cancer and maintain essential features of the original tumors, including metastasis to specific sites. Co-engraftment of primary human mesenchymal stem cells maintains phenotypic stability of the grafts and increases tumor growth by promoting angiogenesis. We also report that tumor engraftment is a prognostic indicator of disease outcome for women with newly diagnosed breast cancer; orthotopic breast tumor grafting is a step toward individualized models for tumor growth, metastasis and prognosis. This bank of tumor grafts also serves as a publicly available resource for new models in which to study the biology of breast cancer.


Figures

Figure 1
Figure 1. ER−PR−HER2− (triple negative) tumors grew more quickly than ER+ or HER2+ tumors as tumor grafts
Growth of primary tumor grafts is represented as tumor volume versus time after engraftment. Tumors were classified by ER, PR, and HER2 status as noted (e.g. −/−/−, in that order). Samples are color coded as shown in Supplementary Table 1 and Figure 5a, and the number in parentheses indicates the passage number depicted on this graph.
Figure 2
Figure 2. Tumor grafts resembled the original tumors from which they were derived
A representative ER−PR−HER2− tumor graft (HCI-001) is shown in comparison to the original patient sample. The tumor ID and the original clinical diagnosis for ER, PR, and HER2 are shown at the top. Sections from the patient’s primary breast tumor (patient), and from representative tumor grafts from the same patient (graft). Stains shown are hematoxylin and eosin (H&E) as well as antibody stains for ER, PR, HER2, cytokeratin (CK), E-cadherin (E-cad), β-catenin (β-cat), and human specific vimentin (hVim). Positive antibody signals are brown in color, with hematoxylin (blue) counterstain. Some images are shown at higher magnification to visualize nuclear staining. All scale bars correspond to 100 microns.
Figure 3
Figure 3. Tumor grafts spontaneously metastasized to clinically relevant sites
Representative examples of a mammary tumor graft (primary tumor) and spontaneous metastases from HCI-011, as detected in sections of axillary lymph nodes and lungs of mice at the time of necropsy. Metastases were easily identifiable by routine histology (H&E; a,c) or by staining with antibodies specific for cytokeratin (b,d,e) or ER (f). Insets are representative pictures of each organ taken prior to fixing/embedding. Scale bars in the main panels correspond to 100 microns, whereas inset scale bars represent 3 millimeters.
Figure 4
Figure 4. Co-engraftment of human mesenchymal stem cells (hMSCs) promotes vascularization and growth of tumor grafts.<
br>a. Left and middle: Growth rates are shown for cohorts of tumor grafts (derived from either the ER+ tumor HCI-005 or the ER− tumor HCI-002) implanted either alone (blue diamonds), or with MSCs (green triangles). Mice injected with MSCs alone are indicated by red circles. Right: Photograph of representative tumors (derived from the ER− tumor HCI-001) grown with (bottom) or without (top) MSCs, isolated 59 days after transplantation. Tumors grown with MSCs were both bloodier and larger. Scale bar represents 5 millimeters. b. H&E staining, and antibody staining for CD31 (inset), identified elaborate vascular networks in tumor grafts in the presence of hMSCs (right panel) compared to the same tumor graft line growing in the absence of hMSCs (left panel). c. Confocal microscopy on thick frozen tumor graft sections showed that blood vessels (identified by lectin staining; green) are in close proximity to, but not comprised of hMSCs (identified by diI label; red).
Figure 5
Figure 5. Gene expression and copy number variations found in the original tumors are well maintained in tumor grafts
a. Hierarchical unsupervised clustering of microarray data (Whole Human Genome Agilent 44k and 24k) from invasive breast cancers and tumor grafts using a 1291 “intrinsic” gene set. The dendrogram shows “normal-like” breast tissue (light green) and the common cancer subtypes referred to as Luminal A (dark blue), Luminal B (light blue), HER2− enriched (pink), and Basal-like (red). Sample that do not clearly associate with any molecular subtype are shown in black. Each matched tumor/tumor graft case is color-coded (see Figure 1 and Supplementary Table 1) followed by a P or a number in the same color to distinguish the parent tumor from the tumor graft(s), respectively (the numbers correspond to the passage number in mice). The designation of +MSC indicates array data from tumors co-injected with MSCs, or the control tumors from the same experiments (−MSC). The parent tumors and tumor graft(s) (whether or not MSCs were co-injected) clustered next to each other on the terminal ends of the dendrogram, and were thus more closely related in their overall gene expression profiles to each other than to other tumors, even of the same subtype. An enlarged view of the sample clusters is shown on the bottom for clarity. b. Genome-wide single nucleotide polymorphism (SNP) arrays were used to discern DNA copy number changes relative to normal DNA (isolated from blood donated by five individual disease-free females and then pooled; top row). Each tumor and the corresponding tumor graft (and, in some cases tumor grafts that were serially passaged five times; 1° or 5°, respectively) are indicated on the left, along with the clinical type of breast cancer represented. Sample identities are shown on the right, along with the status of ER, PR, and HER2. A copy number of 2 (normal) is indicated by gray; copy number greater than 2 (chromosomal gain or amplification) is shown in red; and copy number less than 2 (chromosomal loss or deletion) is shown in blue. The position of the copy number variants across the 22 autosomal chromosomes and 2 sex chromosomes is depicted at the bottom. Note the common amplicons on chromosomes 1q, 7, 8, and 17q (yellow boxes), and the common low copy number of the Y chromosome (all patients and normal donors were female). PE: pleural effusion; IBC: inflammatory breast cancer.
Figure 6
Figure 6. Successful growth of clinical breast cancer primary tumor specimens as tumor grafts significantly predicts shorter survival times
a. Kaplan-Meier survival analysis showing probability of survival for all breast cancer patients examined. The patients were stratified by whether their tumors did not grow or were not able to be maintained in mice (dark blue line) versus those that did grow in mice (red line); p=0.02 by log-rank statistics. b. Kaplan-Meier survival analysis showing probability of survival for new breast cancer patients whose primary tumors either did not grow or were not able to be maintained in mice (dark blue line) versus those that did grow in mice (orange line); p=0.01 by log-rank statistics.

References

    1. Carey LA. Through a glass darkly: advances in understanding breast cancer biology, 2000–2010. Clin Breast Cancer. 2010;10:188–195. - PubMed
    1. Hait WN. Anticancer drug development: the grand challenges. Nat Rev Drug Discov. 2010;9:253–254. - PubMed
    1. Neve RM, et al. A collection of breast cancer cell lines for the study of functionally distinct cancer subtypes. Cancer Cell. 2006;10:515–527. - PMC - PubMed
    1. Kao J, et al. Molecular profiling of breast cancer cell lines defines relevant tumor models and provides a resource for cancer gene discovery. PLoS One. 2009;4:e6146. - PMC - PubMed
    1. Clarke R. The role of preclinical animal models in breast cancer drug development. Breast Cancer Res. 2009;11 (Suppl 3):S22. - PMC - PubMed

Publication types

MeSH terms

Associated data