. 2012 Feb;50(2):198-205.
doi: 10.1016/j.fct.2011.10.031. Epub 2011 Oct 13.

Cadmium exposure activates the ERK signaling pathway leading to altered osteoblast gene expression and apoptotic death in Saos-2 cells

Affiliations

Cadmium exposure activates the ERK signaling pathway leading to altered osteoblast gene expression and apoptotic death in Saos-2 cells

Kate S Arbon et al. Food Chem Toxicol. 2012 Feb.

Abstract

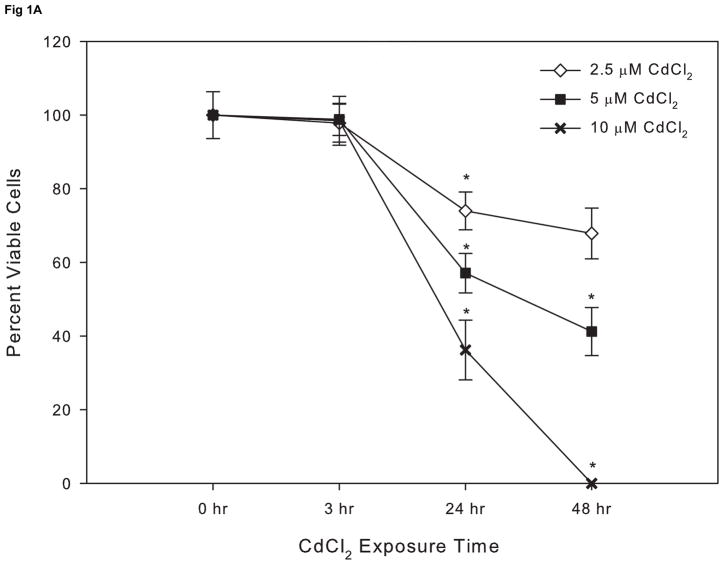
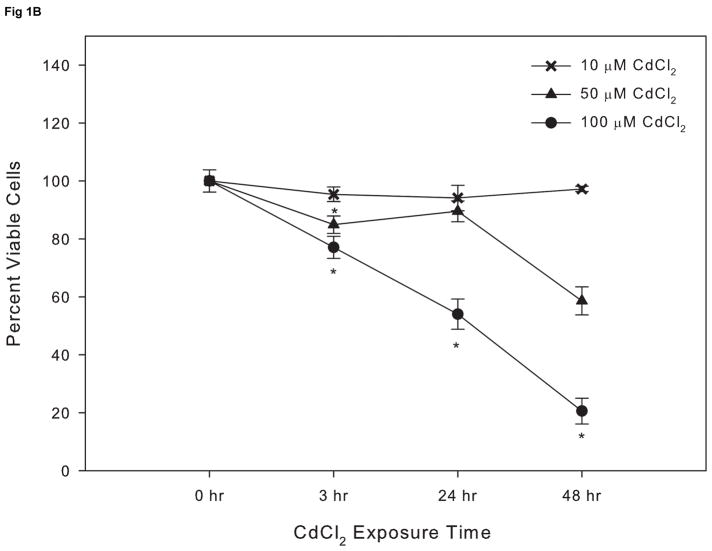
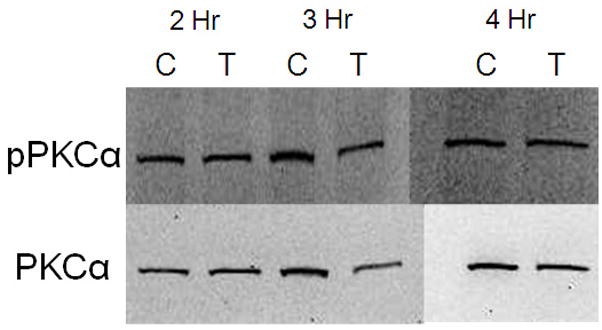
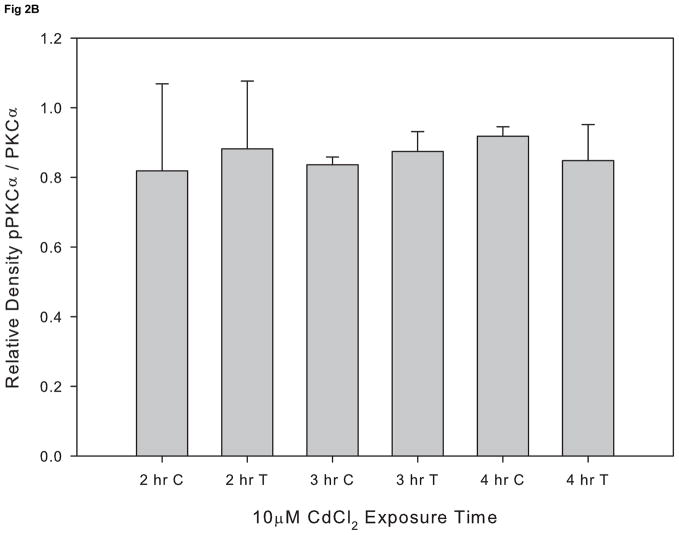
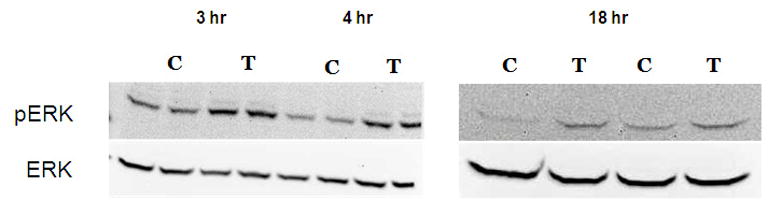
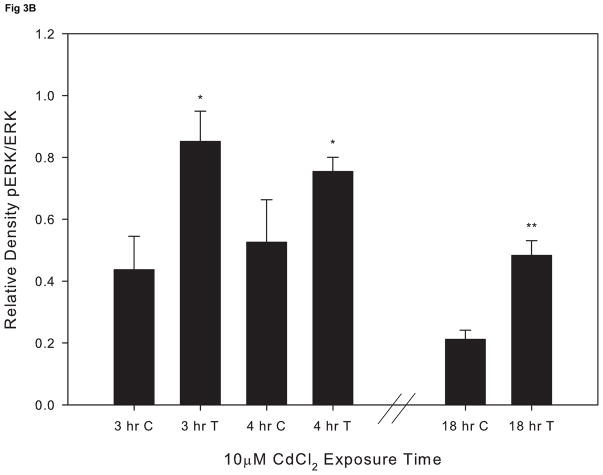
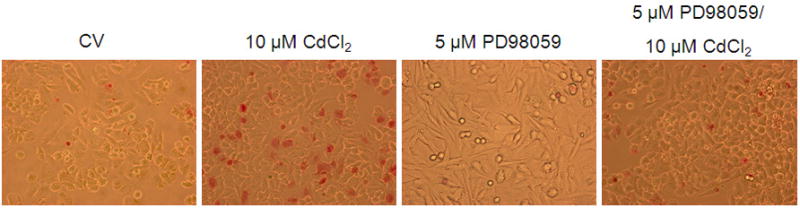
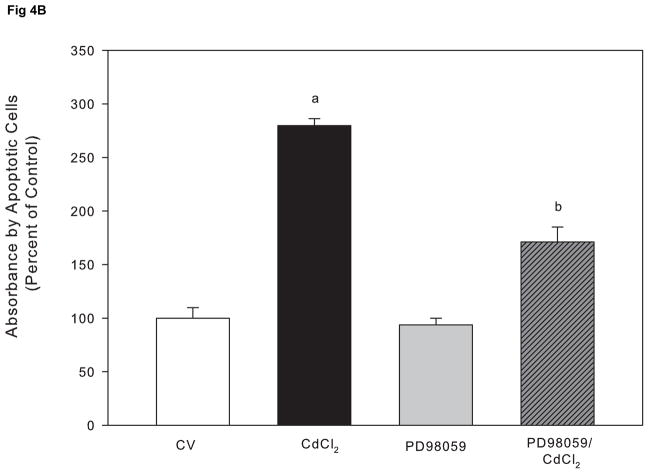
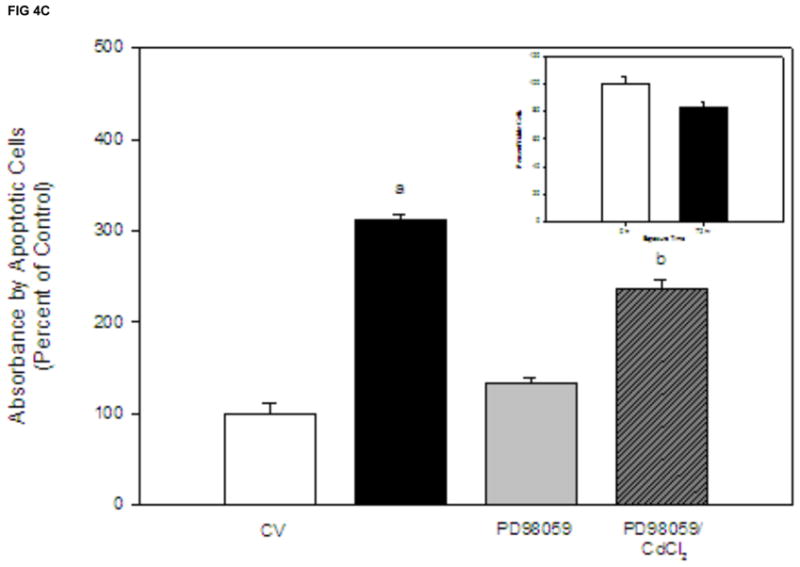
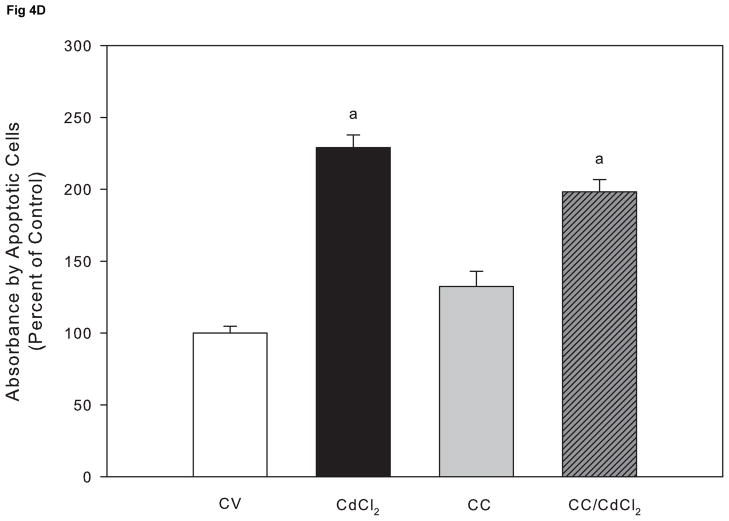
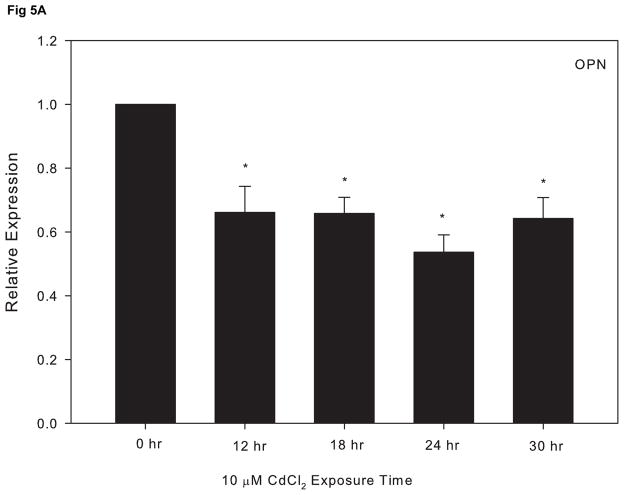
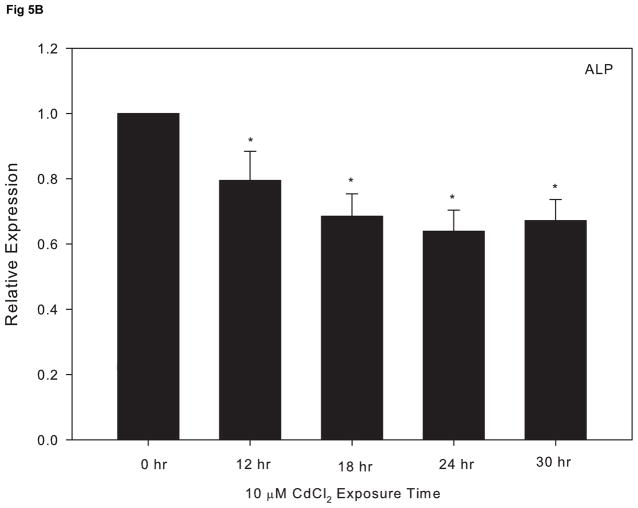
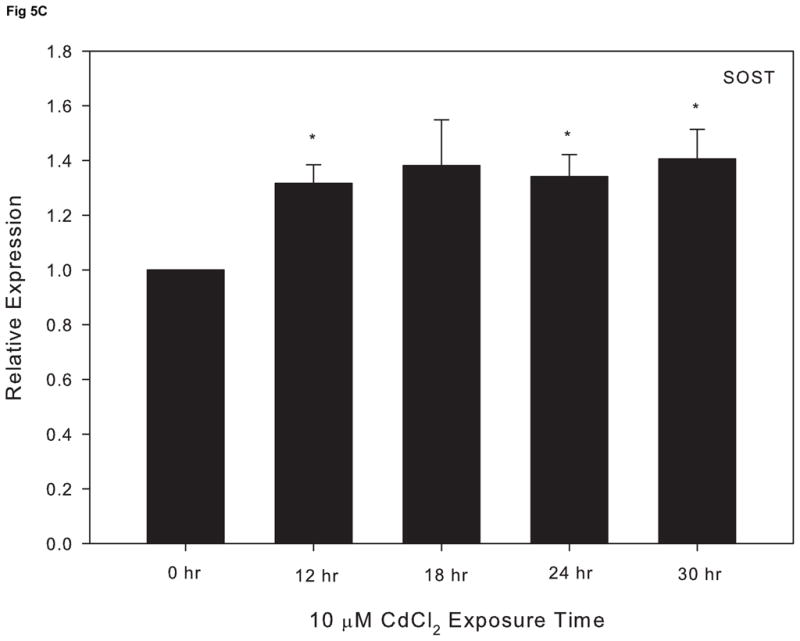
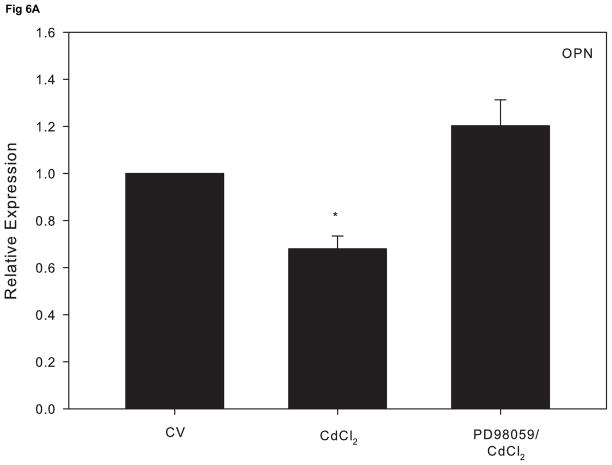
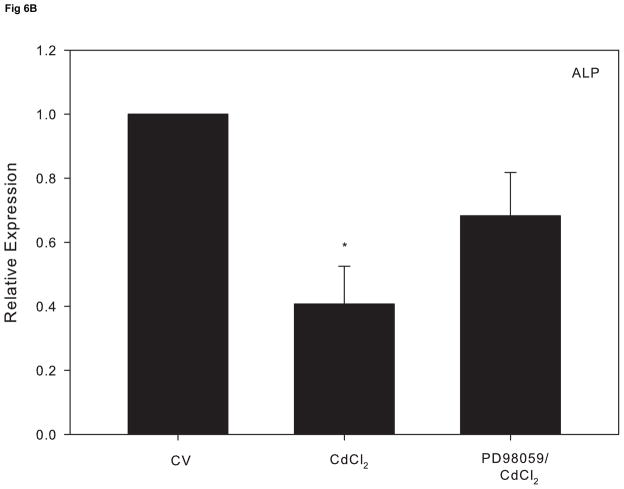
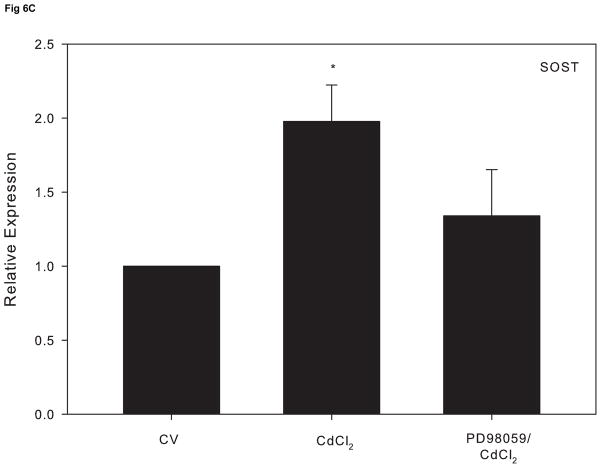
Recent reports of cadmium in electronic waste and jewelry have increased public awareness regarding this toxic metal. Human exposure to cadmium is associated with the development of osteoporosis. We previously reported cadmium induces apoptosis in human tumor-derived Saos-2 osteoblasts. In this study, we examine the extracellular signal-regulated protein kinase (ERK) and protein kinase C (PKC) pathways in cadmium-induced apoptosis and altered osteoblast gene expression. Saos-2 osteoblasts were cultured in the presence or absence of 10μM CdCl(2) for 2-72h. We detected significant ERK activation in response to CdCl(2) and pretreatment with the ERK inhibitor PD98059 attenuated cadmium-induced apoptosis. However, PKCα activation was not observed after exposure to CdCl(2) and pretreatment with the PKC inhibitor, Calphostin C, was unable to rescue cells from cadmium-induced apoptosis. Gene expression studies were conducted using qPCR. Cells exposed to CdCl(2) exhibited a significant decrease in the bone-forming genes osteopontin (OPN) and alkaline phosphatase (ALP) mRNA. In contrast, SOST, whose protein product inhibits bone formation, significantly increased in response to CdCl(2). Pretreatment with PD98059 had a recovery effect on cadmium-induced changes in gene expression. This research demonstrates cadmium can directly inhibit osteoblasts via ERK signaling pathway and identifies SOST as a target for cadmium-induced osteotoxicity.


Figures

Figure 1
Figure 1
The effect of CdCl2 on viability on Saos-2 cells. Cells were treated with 2.5,5, or 10 μM CdCl2 in serum free Opti-MEM medium for 0, 3, 24, or 48hr (A) or 10, 50, or 100 μM CdCl2 in McCoy’s 5A medium supplemented with 10% FBS for 0, 3, 24, or 48 hr (B). Controls received culture medium only. Cell viability was determined using the MTT assay. Results are expressed as percent of viable cells. Each line represents the mean ± SEM of at least 3–6 independent experiments. * denotes significant from control p <0.05.
Figure 1
Figure 1
The effect of CdCl2 on viability on Saos-2 cells. Cells were treated with 2.5,5, or 10 μM CdCl2 in serum free Opti-MEM medium for 0, 3, 24, or 48hr (A) or 10, 50, or 100 μM CdCl2 in McCoy’s 5A medium supplemented with 10% FBS for 0, 3, 24, or 48 hr (B). Controls received culture medium only. Cell viability was determined using the MTT assay. Results are expressed as percent of viable cells. Each line represents the mean ± SEM of at least 3–6 independent experiments. * denotes significant from control p <0.05.
Figure 2
Figure 2
Effect of CdCl2 treatment on pPKCα activation in Saos-2 cells. (A) Representative western blot of pPKCα and PKC at 2, 3, or 4 hr in (C) control or cells treated with (T) 10 μM CdCl2. Controls received culture medium only. (B) Relative density of pPKCα/PKC measured by densitometry. Each bar represents the mean ±SEM of at least three independent experiments.
Figure 2
Figure 2
Effect of CdCl2 treatment on pPKCα activation in Saos-2 cells. (A) Representative western blot of pPKCα and PKC at 2, 3, or 4 hr in (C) control or cells treated with (T) 10 μM CdCl2. Controls received culture medium only. (B) Relative density of pPKCα/PKC measured by densitometry. Each bar represents the mean ±SEM of at least three independent experiments.
Figure 3
Figure 3
Effect of CdCl2 treatment on pERK activation in Saos-2 cells. (A) Representative western blot of pERK and ERK at 3, 4, or 18hr in (C) control or cells treated with (T) 10 μM CdCl2.Controls received culture medium only. (B) Relative density of pERK/ERK measured by densitometry. Each bar represents the mean ±SEM of three independent experiments.* denotes significant from control p <0.05, **p<0.01.
Figure 3
Figure 3
Effect of CdCl2 treatment on pERK activation in Saos-2 cells. (A) Representative western blot of pERK and ERK at 3, 4, or 18hr in (C) control or cells treated with (T) 10 μM CdCl2.Controls received culture medium only. (B) Relative density of pERK/ERK measured by densitometry. Each bar represents the mean ±SEM of three independent experiments.* denotes significant from control p <0.05, **p<0.01.
Figure 4
Figure 4
The effect of pretreatment with PKC inhibitor Calphostin C or the ERK inhibitor PD98059 on apoptosis in CdCl2 treated Saos-2 cells. Apoptosis was determined using APOPercentage dye which is transported in to an apoptotic cell during the translocation of phosphatidylserine from the inner leaflet to the outer leaflet of the cell membrane. (A) Images of pink stained (apoptotic) cells. Saos-2 cells were treated with 10μM CdCl2, 5μM PD98059 only, or pretreated for 1 hr with 5μM PD98059 followed by (B) 48 hr or (C) 72 hr exposure to 10μM CdCl2. An MTT assay was conducted at 72 hrs comparing (white bar) control to (black bar) 10 μM CdCl2 (C insert). (D) Cells were treated with 10μM CdCl2, 0.1μM Calphostin C (CC) only, or pretreated for 1 hr with 0.1μM Calphostin C followed by 48 hr exposure to 10μM CdCl2 or Each bar represents the mean ± SEM of 4–5 independent experiments. a Denotes significant difference from control p < 0.001. b Denotes significant difference from 10 μM CdCl2+DMSO vehicle control cells p < 0.05.
Figure 4
Figure 4
The effect of pretreatment with PKC inhibitor Calphostin C or the ERK inhibitor PD98059 on apoptosis in CdCl2 treated Saos-2 cells. Apoptosis was determined using APOPercentage dye which is transported in to an apoptotic cell during the translocation of phosphatidylserine from the inner leaflet to the outer leaflet of the cell membrane. (A) Images of pink stained (apoptotic) cells. Saos-2 cells were treated with 10μM CdCl2, 5μM PD98059 only, or pretreated for 1 hr with 5μM PD98059 followed by (B) 48 hr or (C) 72 hr exposure to 10μM CdCl2. An MTT assay was conducted at 72 hrs comparing (white bar) control to (black bar) 10 μM CdCl2 (C insert). (D) Cells were treated with 10μM CdCl2, 0.1μM Calphostin C (CC) only, or pretreated for 1 hr with 0.1μM Calphostin C followed by 48 hr exposure to 10μM CdCl2 or Each bar represents the mean ± SEM of 4–5 independent experiments. a Denotes significant difference from control p < 0.001. b Denotes significant difference from 10 μM CdCl2+DMSO vehicle control cells p < 0.05.
Figure 5
Figure 5
The effect of CdCl2 treatment on osteopontin (OPN), alkaline phosphatase (ALP) and sclerostin (SOST) mRNA expression in Saos-2 cells. Cells were treated with 10μM CdCl2 for 0, 12, 18, 24 or 30hr and mRNA expression for (A) OPN, (B) ALP, or (C) SOST was determined using real time PCR and normalized to GAPDH. Each bar represents the mean ± SEM of 3–4 independent experiments. * p <0.05 compared to control.
Figure 5
Figure 5
The effect of CdCl2 treatment on osteopontin (OPN), alkaline phosphatase (ALP) and sclerostin (SOST) mRNA expression in Saos-2 cells. Cells were treated with 10μM CdCl2 for 0, 12, 18, 24 or 30hr and mRNA expression for (A) OPN, (B) ALP, or (C) SOST was determined using real time PCR and normalized to GAPDH. Each bar represents the mean ± SEM of 3–4 independent experiments. * p <0.05 compared to control.
Figure 6
Figure 6
The effect of pretreatment with the ERK inhibitor PD98059 on gene expression in CdCl2 treated Saos-2 cells. Cells were treated with 10μM CdCl2 only or pretreated for 1 hr with 5μM PD98059 followed by 18 hr exposure to 10μM CdCl2. (A) OPN, (B) ALP or (C) SOST gene expression was determined using real time PCR and normalized to GAPDH. Each bar represents the mean ± SEM of 3–4 independent experiments. a Denotes significant difference from control p < 0.05. b Denotes significant difference from 10 μM CdCl2+DMSO vehicle control cells.
Figure 6
Figure 6
The effect of pretreatment with the ERK inhibitor PD98059 on gene expression in CdCl2 treated Saos-2 cells. Cells were treated with 10μM CdCl2 only or pretreated for 1 hr with 5μM PD98059 followed by 18 hr exposure to 10μM CdCl2. (A) OPN, (B) ALP or (C) SOST gene expression was determined using real time PCR and normalized to GAPDH. Each bar represents the mean ± SEM of 3–4 independent experiments. a Denotes significant difference from control p < 0.05. b Denotes significant difference from 10 μM CdCl2+DMSO vehicle control cells.

Similar articles

Cited by

References

    1. Addison WN, Azari F, Sørensen ES, Kaartinen MT, McKee MD. Pyrophosphate Inhibits Mineralization of Osteoblast Cultures by Binding to Mineral, Up-regulating Osteopontin, and Inhibiting Alkaline Phosphatase Activity. Journal of Biological Chemistry. 2007;282(21):15872–15883. - PubMed
    1. Bai X, Lu D, Bai J, Zheng H, Ke Z, Li X, Luo S. Oxidative stress inhibits osteoblastic differentiation of bone cells by ERK and NF-κB. Biochemical and Biophysical Research Communications. 2004;314:197–207. - PubMed
    1. Bodo M, Balloni S, Lumare E, Bacci M, Calvitti M, Dell’Omo M, Murgia N, Marinucci L. Effects of sub-toxic Cadmium concentrations on bone gene expression program: Results of an in vitro study. Toxicology in Vitro. 2010;6:1670–1680. - PubMed
    1. Bhattacharyya MH. Cadmium osteotoxicity in experimental animals: Mechanisms and relationship to human exposures. Toxicology and Applied Pharmacology. 2009;238:258–265. - PMC - PubMed
    1. Bradford M. A rapid and sensitive method for quantification of microgram quantities of protein utilizing the principle of protein-dye-binding. Analytical Biochemistry. 1976;72:248–254. - PubMed

Publication types

MeSH terms

Substances