Review
. 2012 Jan;31(1):65-88.
doi: 10.1016/j.preteyeres.2011.10.001. Epub 2011 Oct 17.

Electrical signaling in control of ocular cell behaviors

Affiliations
Review

Electrical signaling in control of ocular cell behaviors

Min Zhao et al. Prog Retin Eye Res. 2012 Jan.

Abstract

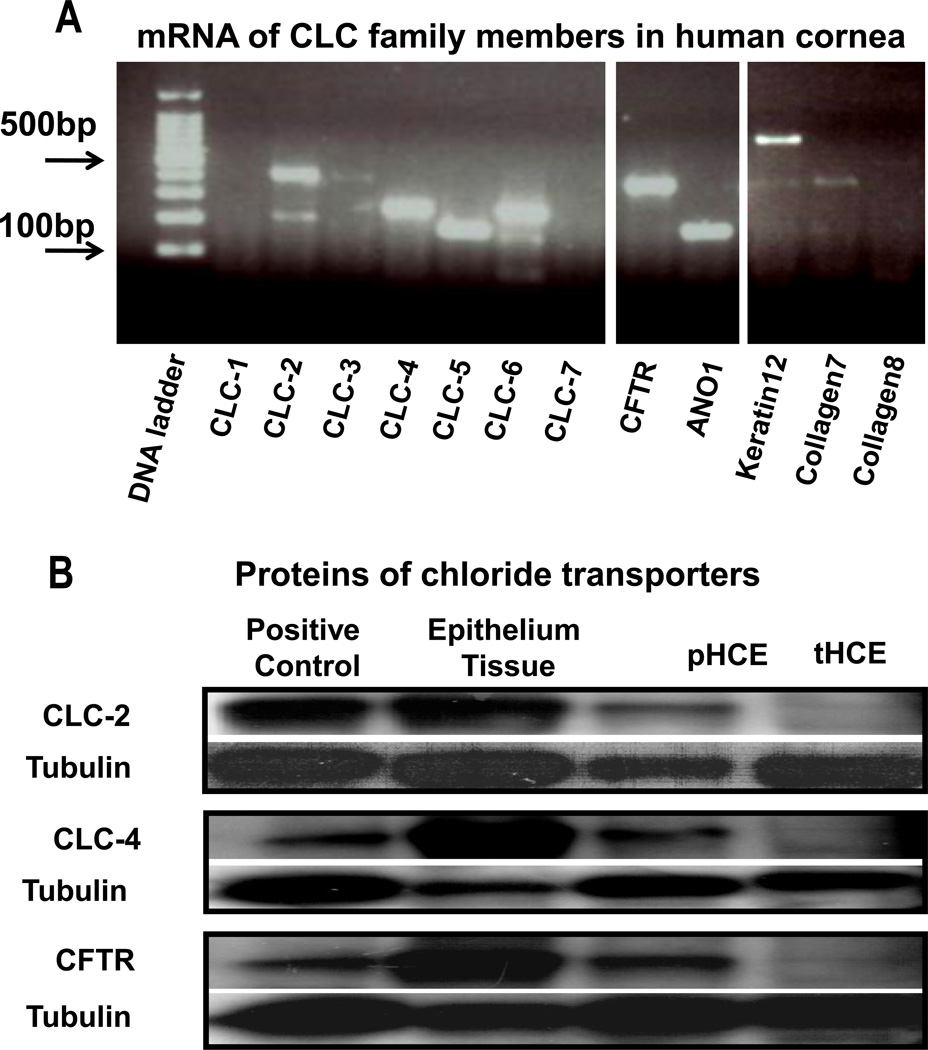
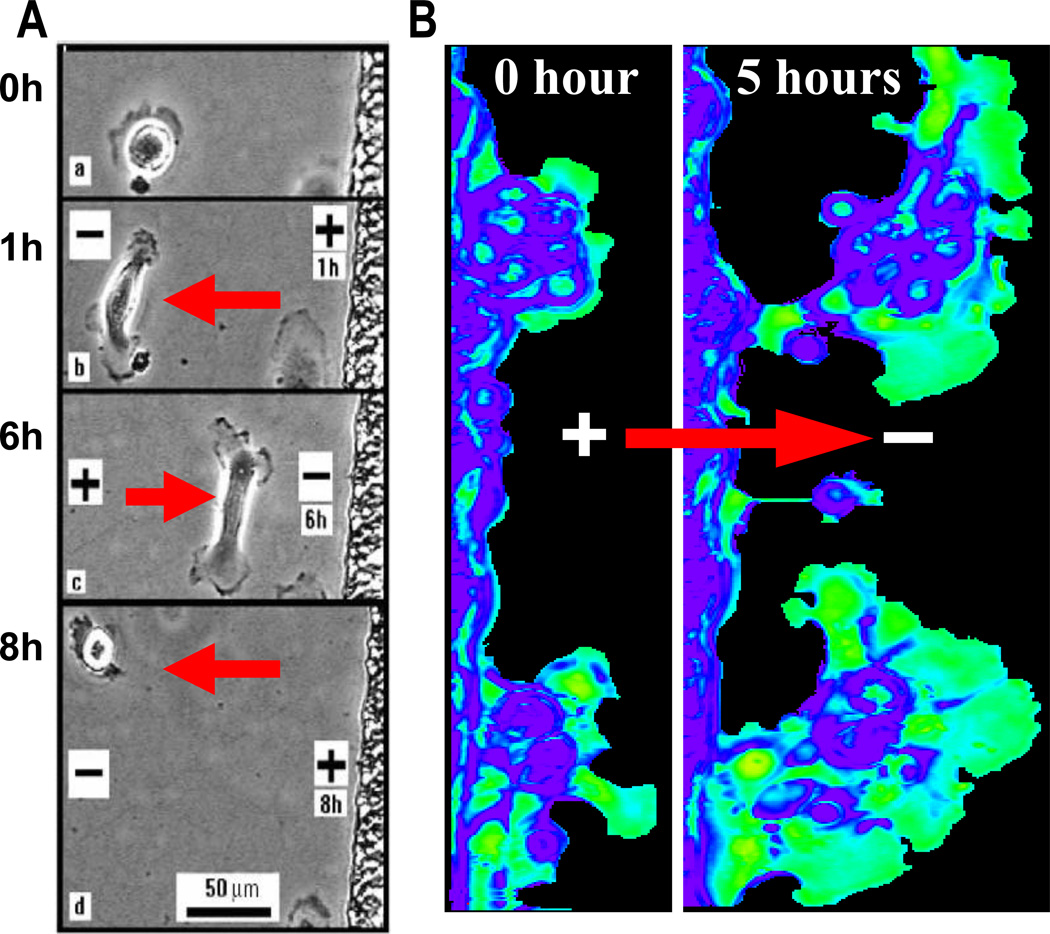
Epithelia of the cornea, lens and retina contain a vast array of ion channels and pumps. Together they produce a polarized flow of ions in and out of cells, as well as across the epithelia. These naturally occurring ion fluxes are essential to the hydration and metabolism of the ocular tissues, especially for the avascular cornea and lens. The directional transport of ions generates electric fields and currents in those tissues. Applied electric fields affect migration, division and proliferation of ocular cells which are important in homeostasis and healing of the ocular tissues. Abnormalities in any of those aspects may underlie many ocular diseases, for example chronic corneal ulcers, posterior capsule opacity after cataract surgery, and retinopathies. Electric field-inducing cellular responses, termed electrical signaling here, therefore may be an unexpected yet powerful mechanism in regulating ocular cell behavior. Both endogenous electric fields and applied electric fields could be exploited to regulate ocular cells. We aim to briefly describe the physiology of the naturally occurring electrical activities in the corneal, lens, and retinal epithelia, to provide experimental evidence of the effects of electric fields on ocular cell behaviors, and to suggest possible clinical implications.


Figures

Figure 1
Figure 1. Membrane potential and transepithelial potential
A. Live cells maintain a resting electric potential across the cell membrane, inside negative. B. An epithelial layer maintains a trans-epithelial potential (TEP) across itself.
Figure 2
Figure 2. A schematic diagram showing ion transporting molecules (ion channels, pumps and transporters) in a corneal epithelial cell. 1,2,3,4,5
Sodium, potassium and chloride channels, respectively; 6. TRP channels; 7. SCE - sodium/calcium exchangers; 8. Sodium/organic co-transporters; 9. Magnesium/calcium ATPase; 10. NKCC - sodium/potassium/chloride co-transporters; 11. Sodium/potassium ATPase; 12. NHE - sodium/proton exchangers; 13. Potassium/proton antiporters; 14. Potassium/chloride co-transporters; 15. Chloride/bicarbonate exchangers. After Levin et al. (Invest. Ophthalmol. Vis. Sci. 2006;47:306–316).
Figure 3
Figure 3. mRNAs and proteins of chloride channels in human corneal epithelial cells
A. RT-PCR products for members of the CLC family. Transformed human corneal epithelial cell samples (tHCE) were used. DNA ladder is on the left. Tissue specific markers are on the right. B. Protein expression. Reprinted with permission from: Cao et al. (Exp. Eye Res. 2010;90(6):771–779).
Figure 4
Figure 4. Chloride currents recorded in human corneal epithelial cells (HCE)
Whole-cell chloride currents recorded from primary cultured HCE (A) and transformed HCE (B). The currents were recorded in bath solutions containing 140 mM chloride (left) or 30 mM chloride (middle). The current-voltage relationships are shown on the right. The zero currents in the recordings are indicated by the dotted lines. Reprinted with permission from: Cao et al. (Exp. Eye Res. 2010;90(6):771–779).
Figure 5
Figure 5. Immunofluorescence staining for CLC family members in human corneal epithelium
In red, CLC family members CLC-2, CLC-3, CLC-4, CLC-6 and CFTR show distinct distribution in human corneal epithelium. Tubulin and DAPI (in blue; labeling nuclei) staining were used as controls. A. CLC-2 is found at both the apical (top) and basal layers of corneal epithelium. B, C. CLC-3 and CLC-4 are expressed at the apical layer only. D, E. CLC-6 and CFTR are distributed preferentially at the apical layer with expression levels gradually decreasing toward the basal layer. Tear side is orientated toward the top and basal to the bottom. Reprinted with permission from: Cao et al. (Exp. Eye Res. 2010;90(6):771–779).
Figure 6
Figure 6. Electric potential in rabbit cornea
A. Schematic illustration of the cornea showing the epithelium (left), a portion of the stroma (st), and the endothelium (e). On the basis of a dye study, the following regions in the electrical profiles were identified: α, the outer membrane of the squamous cell; β, the inner membrane of the basal (b) cells; sw, the region between squamous (s) and wing (w) cells; and wb, the transition region between wing and basal cells. B. Average potential profile for the epithelium. The extracellular gradient in potential from the sub-epithelial stroma to the aqueous humour was less than 1 mV. C. Average resistance profile for the epithelium. The stroma and endothelium contributed only a few percent to total corneal resistance in these preparations. (Reprinted with permission from: Klyce. (J. Physiol. 1972;226(2):407–429).
Figure 7
Figure 7. Electric potential difference across corneal epithelium, and the generation of wound electric fields
A. An electric potential difference, positive at the basal side relative to the tear side, is generated and maintained by net directional electrogenic movement of ions (mainly sodium and chloride) through pumps and channels. B. Wounding which breaks the corneal epithelial barrier (left) leads to the generation of endogenous wound electric currents/fields. Active ion transportation which continues in the intact epithelium (black arrows) underlies the endogenous wound electric field (red solid arrow pointing towards the wound). The return path of the currents (flow of positive charge) is represented by the blue dashed arrow.
Figure 8
Figure 8. Measurement of endogenous wound electric currents in cornea
A. Photograph (side view) of mouse cornea wound. White arrows indicate wound edges. Red dots show measuring positions (a–k). Probe is in measuring position (f). Scale bar = 500 µm. B. Graph showing electric current profile across wound. Current is highest at wound edges, positions (c) and (i). C. Wound current vs. time. Rat cornea wound current increases dramatically after wounding and is maintained at high levels for several hours. A,B. Reprinted with permission from: Reid et al. (Nat. Protoc. 2007;2;661–669). C. Reprinted with permission from: Reid et al. (FASEB J. 2005;19:379–386).
Figure 9
Figure 9. Sodium and chloride fluxes are major components of endogenous electric currents and fields
A. The small outward currents in normal intact rat cornea were significantly reduced (actually reversed to become inward) in sodium-free solution (*P<0.02). B. Corneal wounds had larger currents which were significantly increased in chloride-free solution (**P<0.001). Sodium-free solution significantly reduced wound currents (#P<0.03). Reprinted with permission from: Reid et al. (FASEB J. 2005;19:379–386).
Figure 10
Figure 10. Relative contributions of ions to wound current
A. Wound Timelapse. Overlaying wound electric current data (red) with compiled ion flux data (flux of all ions combined; blue) shows that electric current increase after wounding is due to an increasing ion flux (mainly chloride). B. Combined wound ion flux. Chloride is the major ion contributing to the normal (control) wound current. Enhancement of wound current by aminophylline (Amin.) is mostly due to stimulation of chloride flux, but also by reversal of sodium flux (inward to outward). Reprinted with permission from: Vieira et al. (PLoS One. 2011;6(2):e17411. doi:10.1371/journal.pone.0017411).
Figure 11
Figure 11. Applied electric fields guide migration of corneal epithelial cells
A. An isolated corneal epithelial cell responded to an applied electric field by migrating toward the cathode (0–1 h). Reversing the field (6 and 8 h) reversed the cell migration direction (red arrows). B. Corneal epithelial cell sheets migrate toward the cathode. Pseudo-color images show cathodally-directed migration. EF = 150 mV/mm. Arrow indicates the field vector. A. Reprinted with permission from: Zhao et al. (J. Cell Sci. 1996;109(6):1405–1414). B. Adapted with permission from: Zhao et al. (Invest. Ophthalmol. Vis. Sci. 1996;37:2548–2558).
Figure 12
Figure 12. Wound electric fields may serve as a predominant guidance cue for cell migration into the wound
A. Generally accepted guidance cues for directing epithelial cell migration into the wound include injury stimulation, chemotaxis/haptotaxis, contact inhibition release, wound void, population pressure, and mechanical forces. Endogenous electric fields oriented into the wound (red arrow) have been proposed to be one of the major guidance cues. B, C. An electric field directs migration of corneal epithelial cells in a monolayer model of wound healing. The applied electric field (150 mV/mm) can even make the wound open (0–96 min). Reprinted with permission from: Zhao et al. (Nature. 2006;442(7101):457–60). See online movie: http://www.nature.com/nature/journal/v442/n7101/extref/nature04925-s2.mov
Figure 13
Figure 13. Electric fields direct the migration of stratified epithelia in wound healing
A. Stratified corneal epithelial cells move into the wound under control conditions without an applied electric field. B,C. An applied electric field directs the migration of stratified corneal epithelial cells to move away from the wound (B) or into the wound (C) when the polarity of the applied electric field is reversed. Dotted lines represent the wound edge at the start and dashed lines show the wound edge after the indicated period of time. Arrowheads indicate wound edges and the direction of cell migration. EF in B,C = 150 mV/mm. Reprinted with permission from: Zhao et al. (Nature. 2006;442(7101):457–60). See online movie: http://www.nature.com/nature/journal/v442/n7101/extref/nature04925-s5.mov
Figure 14
Figure 14. Endogenous wound electric currents modulate corneal epithelial wound healing in vivo
A. Treatment with silver nitrate (AgNO3) which enhances epithelial ion transport increased the endogenous electric current at the wound edge. In contrast, furosemide (furo) which inhibits ion transport resulted in a marked decrease in the endogenous electric current at the wound edge (**P<0.05). B. These treatments in turn increased or decreased wound healing rates of rat cornea in vivo. Wounds were labeled with fluorescein. For clarity, the wound edge is marked with dots. C. There is a strong correlation between wound healing rate (y-axis) and endogenous wound electric current (x-axis). Data are mean ± s.e.m. from 3–12 independent eyes. Adapted with permission from: Reid et al. (FASEB J. 2005;19:379–386).
Figure 15
Figure 15. Lens circulation
A. Pattern of electrical current flow around the lens. Currents exit at the equator and enter at both poles. B. Factors responsible for generating lens currents. The transmembrane sodium gradient, which is generated by sodium/potassium pumps, pulls sodium across fiber cell membranes from the extracellular to the intracellular space. Thus, inward radial current is extracellular (1), whereas outward radial current is intracellular (2). Sodium/potassium pump current density, IP (lA/cm2), is highest at the equatorial surface, where the pumps are concentrated to transport the circulating flux of sodium out of the lens. Reprinted with permission from: Mathias et al. (J. Membr. Biol. 2007;216(1):1–16).
Figure 16
Figure 16. Cutting the lens capsule induces significant changes in lens electric current
A. Cutting the anterior capsule (left) as in cataract surgery significantly reduced outward equatorial currents (right). B. Cutting the lens capsule also induced a large inward current at the cut. A. Adapted with permission from: Wang et al. (FASEB J. 2005;19(7):842–844). B. Reprinted with permission from: Reid et al. (Nat. Protoc. 2007;2(3):661–669).
Figure 17
Figure 17. Applied EFs direct migration, expansion, orientation and elongation of primary human lens epithelial cells (PHLECs)
Perpendicular orientation and cathodal migration of PHLECs in an EF of 250 mV/mm; polarity shown. A. No EF (0 hr). B. EF for 5 h, cathode at left. Cells aligned perpendicular to the EF and migrated cathodally with lamellipodia facing the cathode. C. EF reversed for 5 h. LECs and their lamellipodia moved toward the new cathode. Reprinted with permission from: Wang et al. (Exp. Eye Res. 2000;71(1):91–98).
Figure 18
Figure 18. An applied EF directs migration, orientation and elongation of retinal pigment epithelium (RPE) cells
Human RPE cells migrate toward the anode (left) while also elongating and reorientating the long axis of their cell body. EF = 600 mV/mm.
Figure 19
Figure 19. An applied EF activates intracellular signaling pathways
Phosphorylation of Akt (Ser 473) and ERK in primary cultures of mouse keratinocytes in serum-free medium was stimulated in an EF of 150 mV/mm. Adapted with permission from: Zhao et al. (Nature. 2006;442(7101):457–60).
Figure 20
Figure 20. An EF activates PI3 kinase signaling asymmetrically in a migrating cell
Dynamic distribution of PHAkt-GFP, as a probe to detect PIP3 production, was observed to concentrate at the leading edge of HL-60 cells. When polarity of the EF was reversed (170 s), PHAkt-GFP redistributed towards the new leading edge (arrowheads). Arrows show cell migration direction. Reprinted with permission from: Zhao et al. (Nature. 2006;442(7101):457–60). See online movie: http://www.nature.com/nature/journal/v442/n7101/extref/nature04925-s6.mov

References

    1. Akaike N, Kiyohara T. Metabolic component in the epithelial intracellular potential of rabbit cornea. Pflugers Arch. 1977;369:33–37. - PubMed
    1. Al-Nakkash L, Iserovich P, Coca-Prados M, Yang H, Reinach PS. Functional and molecular characterization of a volume-activated chloride channel in rabbit corneal epithelial cells. J Membr Biol. 2004;201:41–49. - PubMed
    1. Al-Nakkash L, Reinach PS. Activation of a CFTR-mediated chloride current in a rabbit corneal epithelial cell line. Invest Ophthalmol Vis Sci. 2001;42:2364–2370. - PubMed
    1. Apple DJ, Solomon KD, Tetz MR, Assia EI, Holland EY, Legler UF, Tsai JC, Castaneda VE, Hoggatt JP, Kostick AM. Posterior capsule opacification. Surv Ophthalmol. 1992;37:73–116. - PubMed
    1. Baehr W, Wu SM, Bird AC, Palczewski K. The retinoid cycle and retina disease. Vision Res. 2003;43:2957–2958. - PubMed

Publication types

LinkOut - more resources