. 2011 Oct 23;18(11):1244-9.
doi: 10.1038/nsmb.2135.

ErbB1 dimerization is promoted by domain co-confinement and stabilized by ligand binding

Affiliations

ErbB1 dimerization is promoted by domain co-confinement and stabilized by ligand binding

Shalini T Low-Nam et al. Nat Struct Mol Biol. .

Abstract

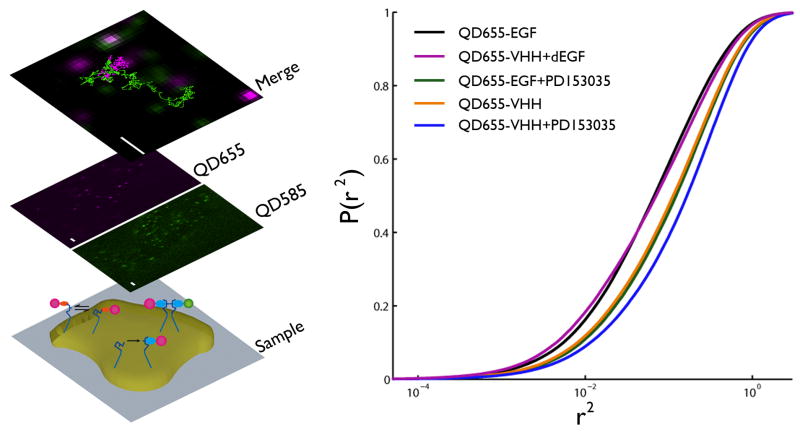
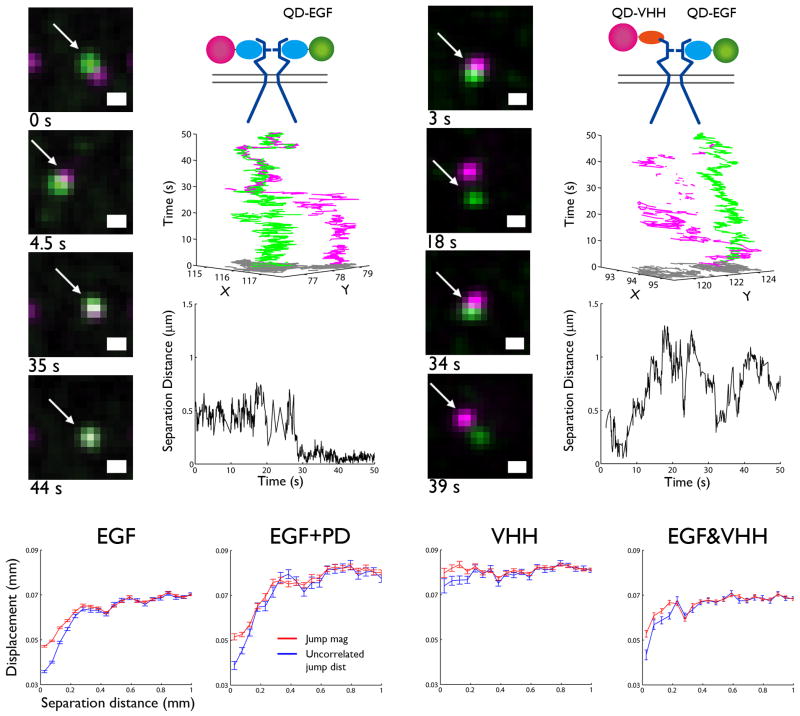
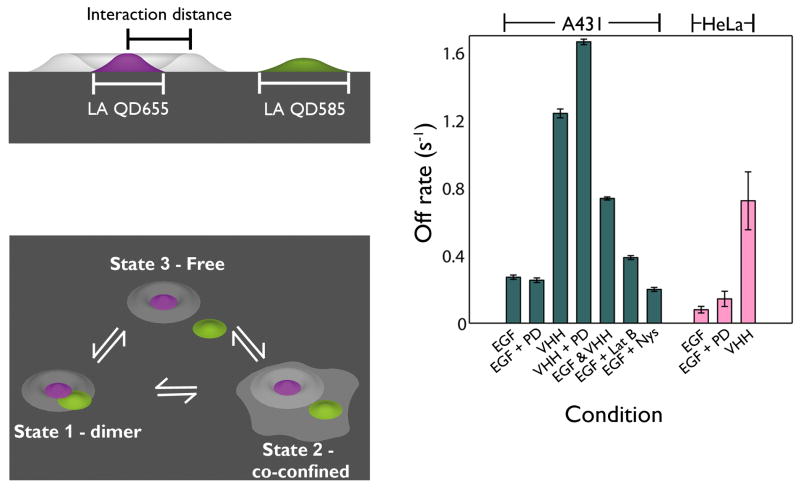
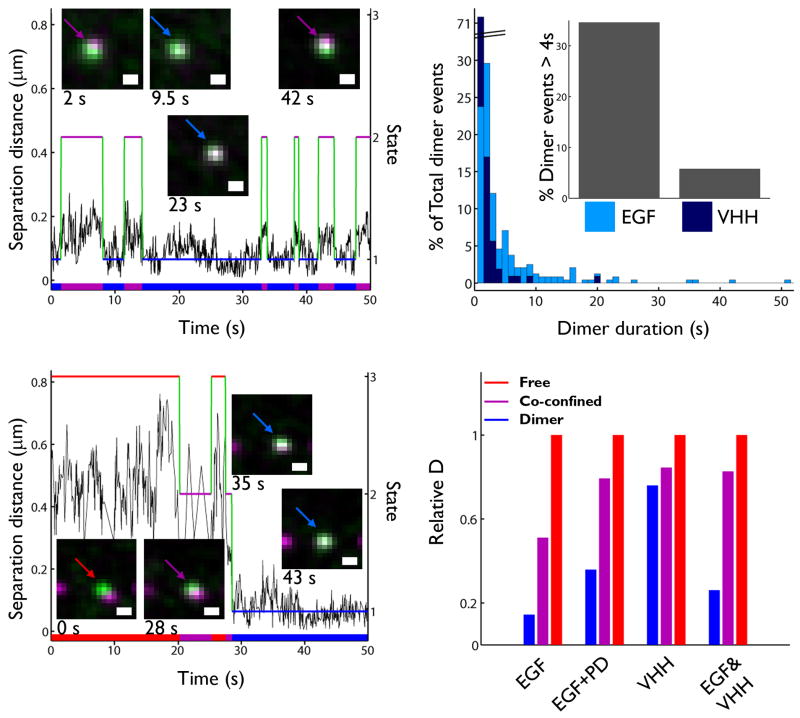
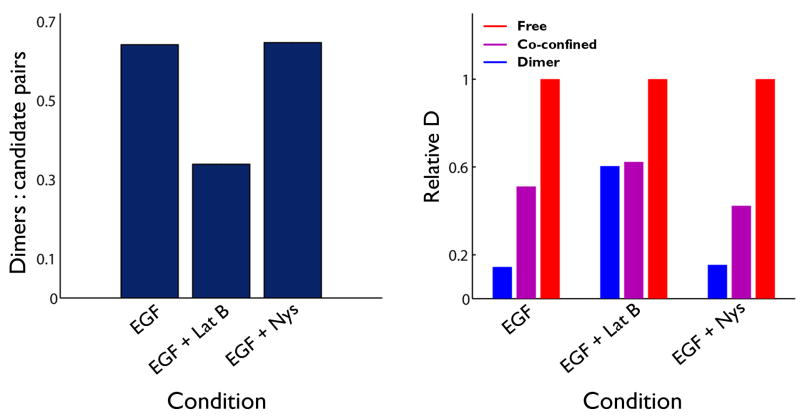
The extent to which ligand occupancy and dimerization contribute to erbB1 signaling is controversial. To examine this, we used two-color quantum-dot tracking for visualization of the homodimerization of human erbB1 and quantification of the dimer off-rate (k(off)) on living cells. Kinetic parameters were extracted using a three-state hidden Markov model to identify transition rates between free, co-confined and dimerized states. We report that dimers composed of two ligand-bound receptors are long-lived and their k(off) is independent of kinase activity. By comparison, unliganded dimers have a more than four times faster k(off). Transient co-confinement of receptors promotes repeated encounters and enhances dimer formation. Mobility decreases more than six times when ligand-bound receptors dimerize. Blockade of erbB1 kinase activity or disruption of actin networks results in faster diffusion of receptor dimers. These results implicate both signal propagation and the cortical cytoskeleton in reduced mobility of signaling-competent erbB1 dimers.


Conflict of interest statement

No conflicts of interest are declared.

Figures

Figure 1
Figure 1
Slowed diffusion as a function of receptor activation is revealed by single QD tracking on the apical surface of A431 cells. (a) Following serum starvation in the absence or presence of PD15035, the activated and resting erbB1 receptor were labeled and tracked on live A431 cells with either two-colors of QD-EGF, QD-VHH, or a combination of each, respectively. Bottom plane: ErbB1 receptor cartoons (blue, not to scale) on the surface of an adherent cell on a coverslip, with probes recognizing the tethered and extended conformations (EGF ligand, light blue; VHH, orange; QD655, magenta; QD585, green). Middle plane: Single molecules were visualized in a QD655 or QD585 channel. Top plane: Following SPT and image registration, trajectories are plotted on the same coordinate system. Scale bar, 2 μm. (b) Cumulative probability plot of squared displacement for QD655 tracking of each condition: QD-EGF (black), QD-VHH + non-fluorescent EGF (purple), QD-VHH (orange), QD-VHH + PD153035 (green), and QD-EGF + PD153035 (blue). A rightward shift in distribution indicates increased diffusion. Fits for two-component square displacement analyses are provided as Supplementary information (Supplementary Table 3).
Figure 2
Figure 2
Direct visualization of erbB1 dimerization is captured by two-color SPT. (a) Sample time series showing dimer formation (white) between QD585-EGF-erbB1 (green) and QD655-EGF-erbB1 (magenta). (b) Cartoon of tracking condition (top), 3D trajectories (middle), and distance between receptors (bottom) as a function of time are shown for the indicated receptors in (a). (c) Sample time series for QD655-EGF-erbB1 and QD585-VHH-erbB1 shows interactions for a 1:2 EGF:erbB1 dimer. (d) Cartoon of tracking condition (top), 3D trajectories (middle), and distance between receptors (bottom) as a function of time are shown for the receptors in (c). Scale bar, 0.5 μm for (a) and (c). (e-h) Ensemble correlated motion plots summarize all two-color data for EGF, EGF+PD, and VHH conditions. A decrease in uncorrelated jump distance (blue) at short separations indicates that receptors are moving together. A concurrent drop in jump magnitude (red) demonstrates decreased diffusion.
Figure 3
Figure 3
Kinetics of homodimerization characterized by a three-state HMM reveal activation state dependent off rates. (a) Definition of a dimer. Two-color receptors are fit with localization accuracies (LA) for each channel; the white probability surface represents the area within which a dimer is identified. The interaction distance (ID) is defined by the crystal structure of the back-to-back erbB1, EGF bound dimer and the diameters of the QDs (40-50 nm). (b) The three states are defined as Free, Co-Confined, and Dimer, based on observed separation. Six kinetic rates are fit for the transitions between these states. (c) Off rates (s-1) for dimers fit using the three-state HMM. Off rate is defined as the sum of the rates of transitions between the dimer-to-domain confined and dimer-to-free states. Values obtained on both A431 and HeLa cells are shown.
Figure 4
Figure 4
State-dependent analysis distinguishes between free, co-confined and dimerized erbB1 characteristics. (a) An example distance trace (black) for two QD-EGF-bound receptors shows close approach punctuated by periods of excursion. Domain state (2, purple) and dimer state (1, blue) are connected by green segments to show state path. This path is projected onto the x-axis to show the timeline of states explored. Stills of the receptors involved in the interaction are inset. (b) Distance and state trace for two QD-EGF bound receptors shows formation of a dimer (Free state in red and others as aforementioned) that persists until the end of the acquisition. Scale bars, 0.5 μm for (a) and (b). (c) Normalized histogram of erbB1 dimer lifetimes for QD-EGF (red) or QD-VHH (yellow) homodimers, determined from Viterbi analysis. Inset shows the raw number of long-lived dimers for each condition. Note that the long-lived dimer duration may be underestimated due to the finite length of the time series. (d) Summary of normalized diffusion coefficients for QD-EGF, QD-EGF+PD, QD-VHH, and QD-EGF&QD-VHH conditions following characterization of states by HMM and Viterbi analyses. Each group of coefficients is normalized to the diffusivity of the free state within that condition.
Figure 5
Figure 5
Disruption of the actin cytoskeleton influences receptor dynamics. (a) Ratio of candidate pairs to dimers provides a measure of dimer frequency as a consequence of pharmacologic treatments. The drop in value for LatB-treated cells indicates that the disruption of cytoskeletal corrals reduces the likelihood for receptor encounters. (b) Summary of normalized diffusion coefficients for receptors bound to QD-EGF in the absence or presence of LatB or Nys treatment. States were identified by HMM and Viterbi analyses. Each group of coefficients is normalized to the free state component within that condition.

Comment in

  • Finding the missing links in EGFR.
    Bessman NJ, Lemmon MA. Bessman NJ, et al. Nat Struct Mol Biol. 2012 Jan 5;19(1):1-3. doi: 10.1038/nsmb.2221. Nat Struct Mol Biol. 2012. PMID: 22218287 No abstract available.

References

    1. Schlessinger J. Ligand-induced, receptor-mediated dimerization and activation of EGF receptor. Cell. 2002;110:669–672. - PubMed
    1. Ferguson KM, et al. EGF activates its receptor by removing interactions that autoinhibit ectodomain dimerization. Mol Cell. 2003;11:507–517. - PubMed
    1. Alvarado D, Klein DE, Lemmon MA. Structural basis for negative cooperativity in growth factor binding to an EGF receptor. Cell. 2010;142:568–579. - PMC - PubMed
    1. Chung I, et al. Spatial control of EGF receptor activation by reversible dimerization on living cells. Nature. 2010;464:783–787. - PubMed
    1. Clayton AH, et al. Ligand-induced dimer-tetramer transition during the activation of the cell surface epidermal growth factor receptor-A multidimensional microscopy analysis. J Biol Chem. 2005;280:30392–30399. - PubMed

Publication types