. 2012 Jun 21;31(25):3039-50.
doi: 10.1038/onc.2011.474. Epub 2011 Oct 24.

Acquired MET expression confers resistance to EGFR inhibition in a mouse model of glioblastoma multiforme

Affiliations

Acquired MET expression confers resistance to EGFR inhibition in a mouse model of glioblastoma multiforme

H J Jun et al. Oncogene. .

Abstract

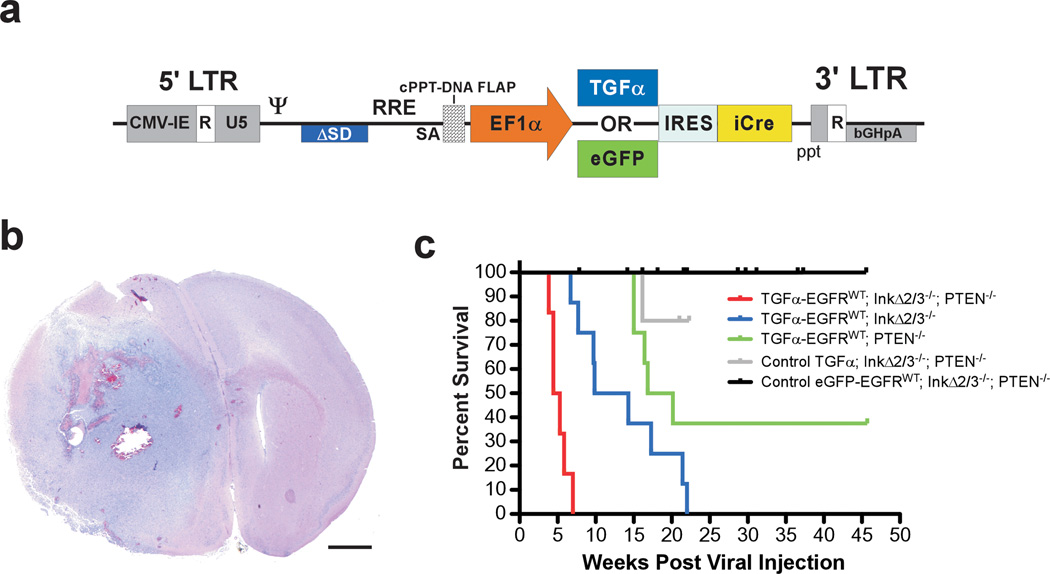
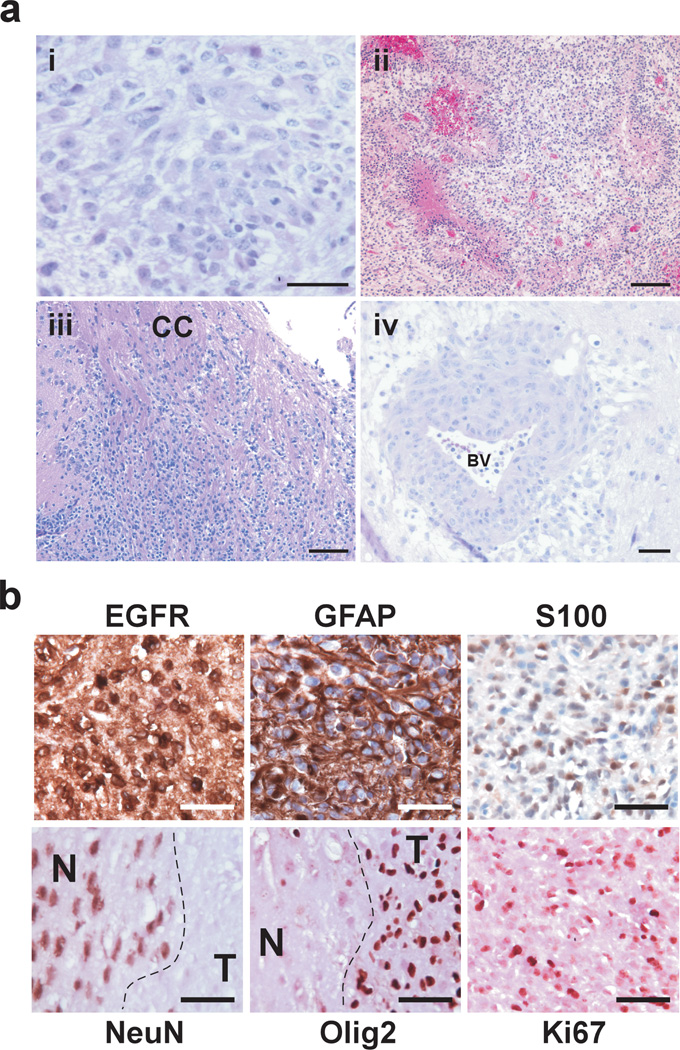
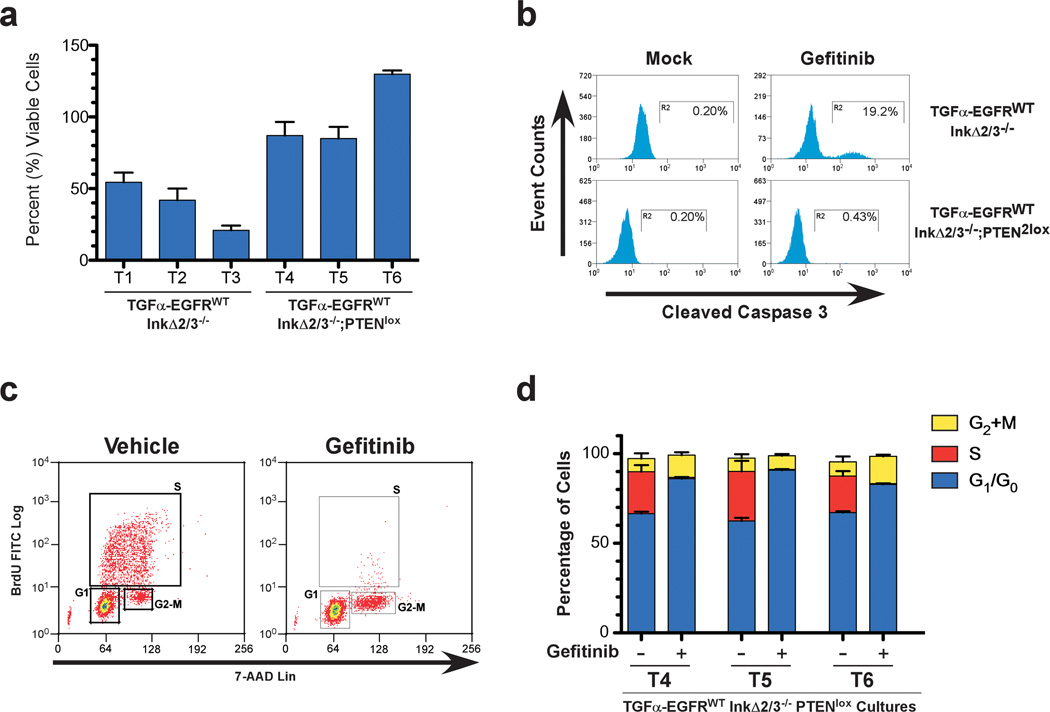
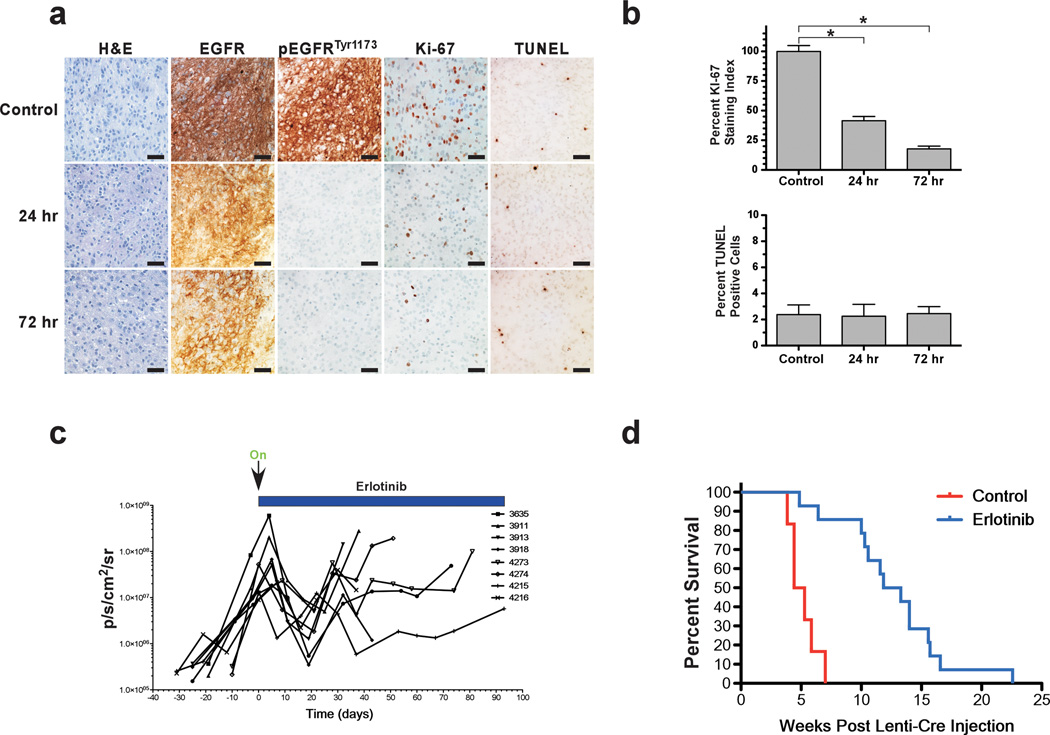
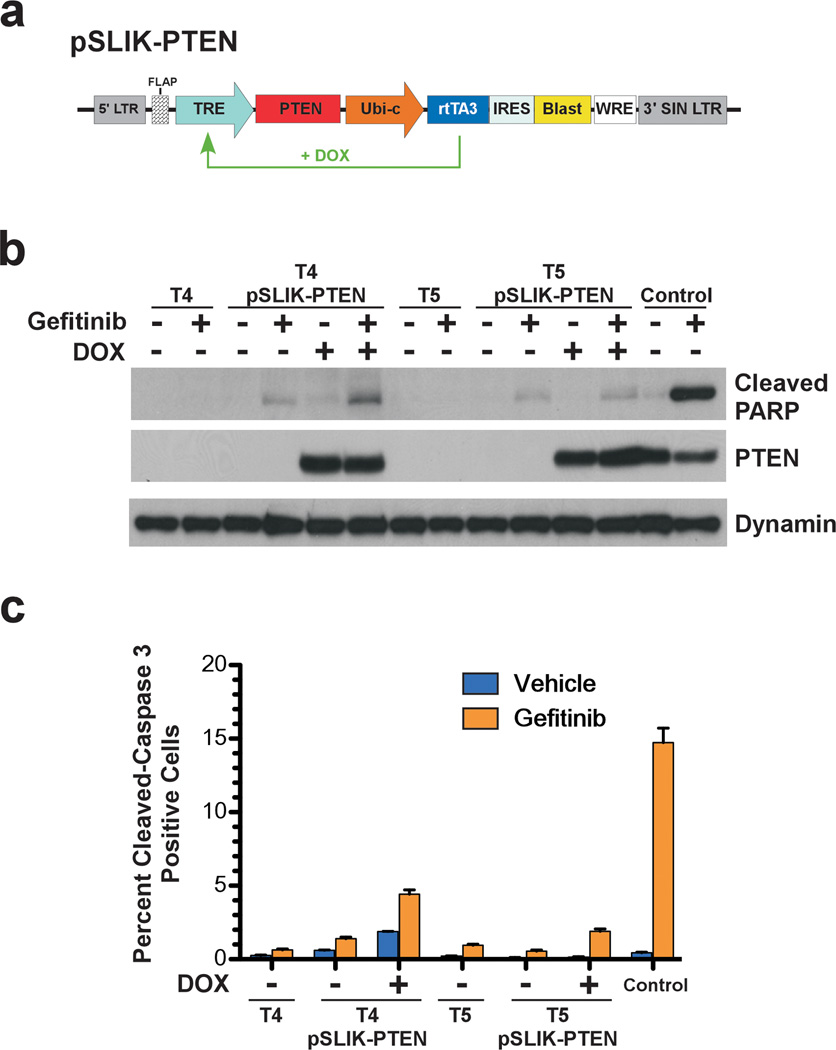
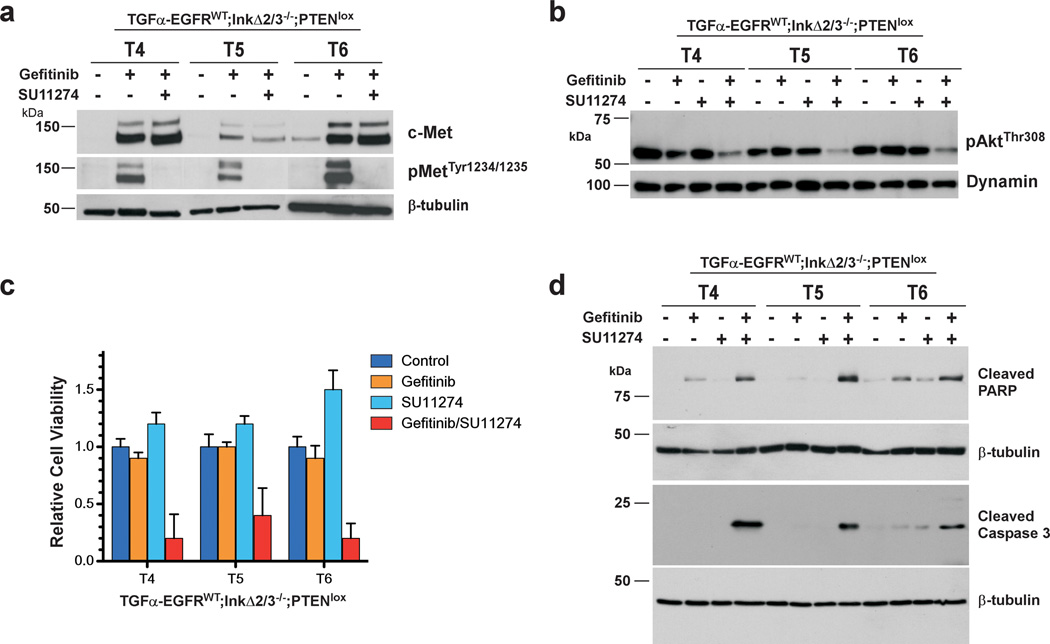
Glioblastoma multiforme (GBM) is an aggressive brain tumor for which there is no cure. Overexpression of wild-type epidermal growth factor receptor (EGFR) and loss of the tumor suppressor genes Ink4a/Arf and PTEN are salient features of this deadly cancer. Surprisingly, targeted inhibition of EGFR has been clinically disappointing, demonstrating an innate ability for GBM to develop resistance. Efforts at modeling GBM in mice using wild-type EGFR have proven unsuccessful to date, hampering endeavors at understanding molecular mechanisms of therapeutic resistance. Here, we describe a unique genetically engineered mouse model of EGFR-driven gliomagenesis that uses a somatic conditional overexpression and chronic activation of wild-type EGFR in cooperation with deletions in the Ink4a/Arf and PTEN genes in adult brains. Using this model, we establish that chronic activation of wild-type EGFR with a ligand is necessary for generating tumors with histopathological and molecular characteristics of GBMs. We show that these GBMs are resistant to EGFR kinase inhibition and we define this resistance molecularly. Inhibition of EGFR kinase activity using tyrosine kinase inhibitors in GBM tumor cells generates a cytostatic response characterized by a cell cycle arrest, which is accompanied by a substantial change in global gene expression levels. We demonstrate that an important component of this pattern is the transcriptional activation of the MET receptor tyrosine kinase and that pharmacological inhibition of MET overcomes the resistance to EGFR inhibition in these cells. These findings provide important new insights into mechanisms of resistance to EGFR inhibition and suggest that inhibition of multiple targets will be necessary to provide therapeutic benefit for GBM patients.


Conflict of interest statement

The authors have declared that no conflict of interest exists.

Figures

Figure 1
Figure 1
EGFRWT cooperates with loss of tumor suppressor genes to form brain tumors. (a) Schematic representation of the self-inactivating bicistronic lentiviral transducing vectors. These vectors carry a cassette composed of either the human TGFα cDNA or enhanced green fluorescent protein (eGFP) gene (for control experiments) followed by a human poliovirus1 internal ribosomal entry site (IRES) and improved Cre recombinase (iCre) cDNA (Shimshek et al., 2002) driven by the human elongation factor-1α (EF1α) promoter. The message is stabilized by the presence of the bovine growth hormone poly adenylation signal sequence. These lentiviral vectors were derived from a previously described vector (Coleman et al., 2003). The presence of a central polypurine tract (cPPT)-DNA FLAP element upstream of the multiple cloning site significantly improves the transduction efficiency in CNS tissues (Follenzi et al., 2000; Zennou et al., 2001). LTR; long terminal repeat. (b) Photomicrograph of an H&E-stained coronal section of a representative TGFα-EGFRWT;InkΔ2/3−/−;PTENlox brain tumor. Scale bar; 1.0 mm. (c) Survival (Kaplan-Meier) analysis of conditional EGFRWT mice. Cohorts of mice of the indicated genotypes were stereotactically injected in the striatum with titer-matched pTyf-TGFα-IRES-iCre or pTyf-eGFP-IRES-iCre viruses and monitored for survival over time.
Figure 2
Figure 2
Representative photomicrographs of H&E-stained histological sections of TGFα-EGFRWT tumors. (a) (i) Tumor cells are set on a fibrillary background and contain densely packed cells featuring pleomorphic nuclei with prominent nucleoli. (ii) Tumors exhibit marked pseudo pallisading necrosis. (iii-iv) The highly infiltrative nature of TGFα-EGFRWT tumor cells is depicted. (iii) Tumor cells migrate and infiltrate parenchyma along white matter tracks (corpus callosum CC) and (iv) migrate along blood vessels (BV) and invade the perivascular space. Scale bars; 50 µm (i,iv), 125 µm (ii, iii). (b) TGFα-EGFRWT tumors express markers of astrocytic differentiation. Representative photomicrographs of TGFα-EGFRWT tumors stained for the indicated cell lineage markers using immunohistochemistry. Tumors stain positive for the astrocytic lineage markers glial fibrillary acidic protein (GFAP) and S100 and negative for the neuronal lineage marker NeuN. Tumors also stain positive for human EGFR, the proliferation marker Ki67 and for Olig2. EGFR, GFAP and S100 sections were counterstained with hematoxylin and sections for the nuclear NeuN, Olig2 and Ki67 markers were counterstained with eosin. N, normal brain; T, tumor. Scale bars 50 µm.
Figure 3
Figure 3
Cytostaticity of EGFR kinase inhibition in TGFα-EGFRWT GBM tumor cells. (a) TGFα-EGFRWT;InkΔ2/3−/− tumor cells are sensitive to gefitinib treatment whereas TGFα-EGFRWT;InkΔ2/3−/−;PTENlox cells are resistant. Viability assays of three independent tumor cell cultures from the indicated genotypes after vehicle or gefitinib treatment (10 µM) for 24 hours. Data is plotted as percentage of viable cells of treated over vehicle treatment (mean ± SD; n=3 in each group). (b) Representative flow-cytometric analysis of vehicle- and gefitinib-treated TGFα-EGFRWT;InkΔ2/3−/− and TGFα-EGFRWT;InkΔ2/3−/−;PTENlox GBM tumor cells indicating an increase in cleaved caspase-3 positive cells upon EGFR kinase inhibitor treatment. (c) Primary tumor cultures from TGFα-EGFRWT;InkΔ2/3−/−;PTENlox GBMs were incubated overnight in low serum (0.1% FBS) media then challenged with 10 µM of gefitinib for 24 hours. BrdU incorporation and 7-AAD levels were measured by flow cytometry to determine cell cycle profiles for treated and untreated cultures. Representative plots for BrdU incorporation vs. 7-AAD levels for determination of cell cycle profiles in vehicle and gefitinib-treated cells are shown. (d) Graphical representation of the distribution (percentage) of cells in G2+M, S, or G1/G0 for TGFα-EGFRWT;InkΔ2/3−/−;PTENlox GBM cultures T4, T5, and T6. The small percentage of cells in sub-G1 is not included in this graph. (mean ± SD; n=3 in each group).
Figure 4
Figure 4
Inhibition of EGFR prolongs survival in mice. (a) Treatment of TGFα-EGFRWT;InkΔ2/3−/−;PTENlox mice with the EGFR TKI erlotinib inhibits EGFR activity. Mice were treated with erlotinib formulated in Ora-Plus (Paddock Lab) and administered by oral gavage daily Monday to Friday at 150mg/kg dose and sacrificed at the indicated times and processed for histology. IHC of representative GBM tumors for total human EGFR expression, activated EGFR (pTyr1173), the proliferation marker Ki-67 and for apoptosis by TUNEL are shown. (b) Graphical representation of the quantification of proliferation assayed by Ki-67 staining and for the percentage of apoptotic cells as measured by the number of TUNEL positive cells. The Ki-67 staining data is presented as percentage of Ki-67 positive cells in treated tumors over control tumors (*p<0.001, two-tailed t-test) and quantification of apoptosis is presented as percentage of TUNEL positive cells per field of view. (c) Bioluminescence imaging monitoring of treatment course. EGFRWT;InkΔ2/3−/−;PTEN2lox mice were injected with pTyf-TGFα-IRES-iCre lentivirus and 14 days later were imaged for presence of tumor. Once tumors were detected, animals were imaged once a week. Initiation of treatment with erlotinib commenced once BLI values surpassed 1.0 × 10⁷ photons/sec/cm2/sr. Animals were treated with erlotinib on a schedule of five days on 2 days off and monitored for response using BLI (d) Animals remained on this treatment until moribund to establish overall survival. Kaplan-Meier survival curves of control (red, n=6) and erlotinib-treated (blue, n=14) tumor bearing animals. The difference in survival is significant, p<0.0001, Log-rank (Mantel-Cox) test.
Figure 5
Figure 5
PTEN re-expression in GBM tumor cells does not confer sensitivity to EGFR kinase inhibition. (a) Schematic representation of the pSLIK-PTEN lentiviral vector for Tet-inducible expression of PTEN. The original pSLIK vector (Shin et al., 2006; Zhu et al., 2007) was modified to confer blasticidine resistance as described in Supplementary Information. (b) Immunoblot analysis of total cell lysates from PTEN deficient GBM tumor cell cultures (T4 & T5) re-expressing PTEN probed for cleaved PARP. Control cultured cells sensitive to gefitinib-induced apoptosis are derived from a TGFα-EGFRWT;InkΔ2/3−/− tumor. (c) Graphical representation of flow cytometry analysis of cleaved caspase-3 in PTEN deficient and isogenic PTEN re-expressing GBM tumor cell cultures (T4 & T5) (mean ± SD; n=3 in each group).
Figure 6
Figure 6
Gefitinib treatment increases expression and activation of c-Met in PTEN deficient GBM tumor cells. (a) Representative qRT-PCR from total RNA isolated from a TGFα-EGFRWT;InkΔ2/3−/−;PTENlox tumor culture (T5) treated with gefitinib (10 µM) for the indicated time. (b) Immunoblot of total cell lysates isolated from cells as in (a) and probed using antibodies against the indicated proteins. (c) Graphical representation of luciferase reporter assay results. A 3.5 kb fragment of the mouse c-Met promoter was used to drive the expression of firefly luciferase. Control plasmid (pGL4.10[luc2]) was used as a negative control. Firefly luciferase plasmids were co-transfected with TK-renilla luciferase internal transfection efficiency control plasmid. Cells were treated with gefitinib (10 µM) for 24 hours and luciferase outputs measured using a luminometer. Relative Light Units represent the ratio of firefly/renilla luc (mean ± SD; n=3 in each group). (d) Representative H&E and IHC against MET on tumor brain sections from treatment of TGFα-EGFRWT;InkΔ2/3−/−;PTENlox tumor-bearing mice with EGFR TKI (erlotinib, 150 mg/kg).
Figure 7
Figure 7
Inhibition of c-MET sensitizes PTEN deficient tumor cells to EGFR TKI-induced apoptosis. PTEN deficient TGFα-EGFRWT;InkΔ2/3−/−;PTENlox GBM tumor cells were treated with gefitinib (10 µM) and/or the c-MET kinase inhibitor SU11274 (10 µM). (a) Immunoblot analysis of total cell lysates from TGFα-EGFRWT;InkΔ2/3−/−;PTENlox GBM tumor cells treated with the indicated inhibitors using c-MET and c-MET phosphotyrosine 1234,1235 antibodies. Anti β-tubulin probing is used as an internal loading control. (b) Activation of Akt is attenuated by inhibition of c-MET. Immunoblot analysis of total cell lysates against phospho Akt (Thr308) in TGFα-EGFRWT;InkΔ2/3−/−;PTENlox GBM tumor cells. Anti dynamin probing is used as an internal loading control. (c,d) Inhibition of c-MET induces apoptosis. Co-treatment of TGFα-EGFRWT;InkΔ2/3−/−;PTENlox GBM tumor cells with gefitinib and SU11274 causes a marked reduction in the relative viability of these cells (c). This reduced viability corresponds to an increase in the rate of drug-induced apoptosis (d) as demonstrated by immunoblot analysis of cleaved caspase 3 and cleaved PARP.

References

    1. Andl CD, Mizushima T, Nakagawa H, Oyama K, Harada H, Chruma K, et al. Epidermal growth factor receptor mediates increased cell proliferation, migration, and aggregation in esophageal keratinocytes in vitro and in vivo. J Biol Chem. 2003;278:1824–1830. - PubMed
    1. Brennan C, Momota H, Hambardzumyan D, Ozawa T, Tandon A, Pedraza A, et al. Glioblastoma subclasses can be defined by activity among signal transduction pathways and associated genomic alterations. PLoS One. 2009;4:e7752. - PMC - PubMed
    1. Busse D, Doughty RS, Ramsey TT, Russell WE, Price JO, Flanagan WM, et al. Reversible G(1) arrest induced by inhibition of the epidermal growth factor receptor tyrosine kinase requires up-regulation of p27(KIP1) independent of MAPK activity. J Biol Chem. 2000;275:6987–6995. - PubMed
    1. Cheng J, Huang H, Zhang ZT, Shapiro E, Pellicer A, Sun TT, et al. Overexpression of epidermal growth factor receptor in urothelium elicits urothelial hyperplasia and promotes bladder tumor growth. Cancer Res. 2002;62:4157–4163. - PubMed
    1. Ciardiello F, McGeady ML, Kim N, Basolo F, Hynes N, Langton BC, et al. Transforming growth factor-alpha expression is enhanced in human mammary epithelial cells transformed by an activated c-Ha-ras protooncogene but not by the c-neu protooncogene, and overexpression of the transforming growth factor-alpha complementary DNA leads to transformation. Cell Growth Differ. 1990;1:407–420. - PubMed

Publication types

Substances