. 2011 Oct 23;29(11):1011-8.
doi: 10.1038/nbt.2005.

SIRPA is a specific cell-surface marker for isolating cardiomyocytes derived from human pluripotent stem cells

Affiliations

SIRPA is a specific cell-surface marker for isolating cardiomyocytes derived from human pluripotent stem cells

Nicole C Dubois et al. Nat Biotechnol. .

Abstract

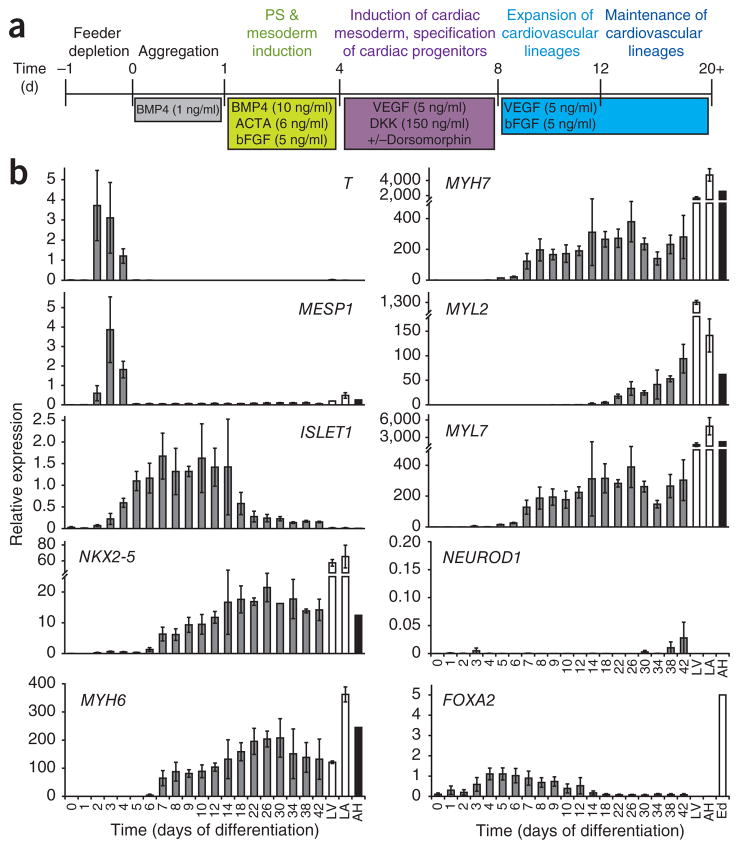
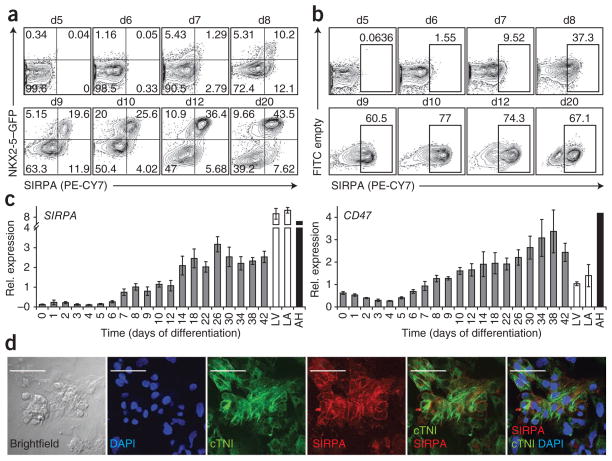
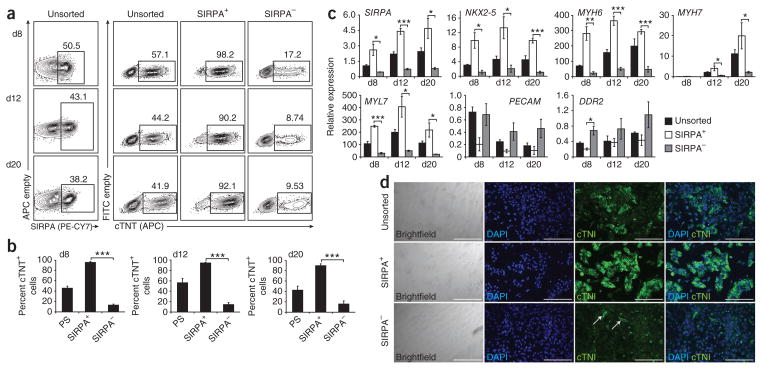
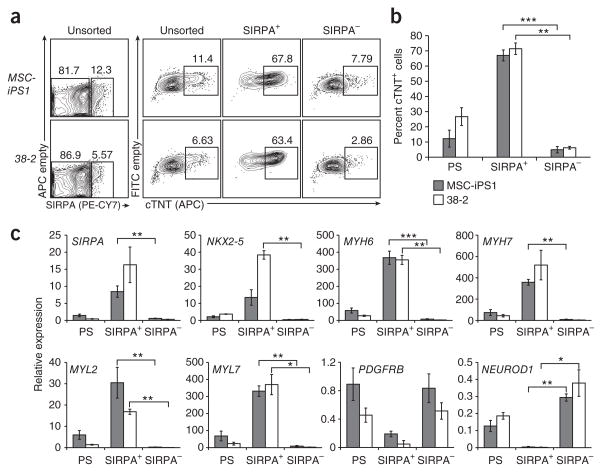
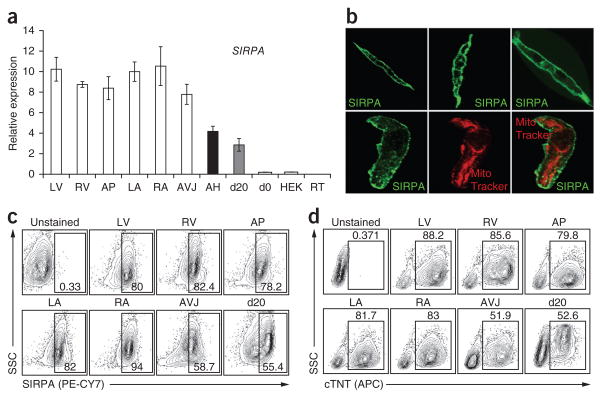
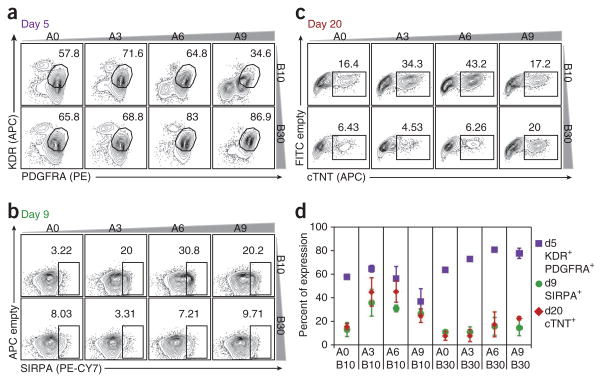
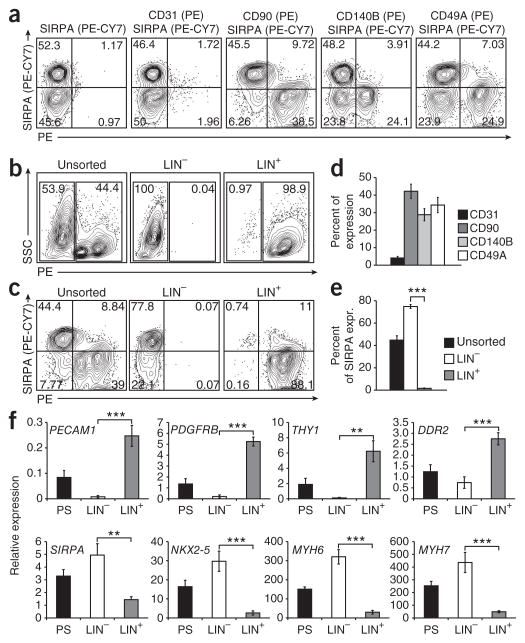
To identify cell-surface markers specific to human cardiomyocytes, we screened cardiovascular cell populations derived from human embryonic stem cells (hESCs) against a panel of 370 known CD antibodies. This screen identified the signal-regulatory protein alpha (SIRPA) as a marker expressed specifically on cardiomyocytes derived from hESCs and human induced pluripotent stem cells (hiPSCs), and PECAM, THY1, PDGFRB and ITGA1 as markers of the nonmyocyte population. Cell sorting with an antibody against SIRPA allowed for the enrichment of cardiac precursors and cardiomyocytes from hESC/hiPSC differentiation cultures, yielding populations of up to 98% cardiac troponin T-positive cells. When plated in culture, SIRPA-positive cells were contracting and could be maintained over extended periods of time. These findings provide a simple method for isolating populations of cardiomyocytes from human pluripotent stem cell cultures, and thereby establish a readily adaptable technology for generating large numbers of enriched cardiomyocytes for therapeutic applications.


Conflict of interest statement

COMPETING FINANCIAL INTERESTS

The authors declare competing financial interests: details accompany the full-text HTML version of the paper at http://www.nature.com/naturebiotechnology.

Figures

Figure 1
Figure 1
Specification of the cardiovascular lineage from hESCs. (a) Outline of the protocol used to differentiate hESCs to the cardiac lineage (modified from ref. 3). (b) QPCR analysis of T, MESP1, ISLET1, NKX2-5, MYH6, MYH7, MYL2, MYL7, NEUROD1 and FOXA2 in HES2-derived embryoid bodies at different stages during differentiation. Day 0, hESCs; LV, human fetal left ventricle; LA, human fetal left atria; AH, human adult heart, Ed, hESC-derived endoderm. Error bars represent s.e.m., n = 3.
Figure 2
Figure 2
Expression of the cell-surface receptor SIRPA during hESC differentiation. (a) Flow cytometric analysis of SIRPA on embryoid bodies derived from NKX2-5–GFP hESCs. d; day of differentiation. (b) Expression of SIRPA on HES2-derived embryoid body populations at the indicated times. (c) RT-qPCR analysis of expression of SIRPA and its ligand CD47 in HES2-derived embryoid bodies at different times of differentiation. Day 0, ESCs; LV, human fetal left ventricle; LA, human fetal left atrial; AH, human adult heart. Error bars represent s.e.m., n = 4. (d) Immunostaining for SIRPA and cTNI on cardiac monolayer cultures. Monolayers were generated from day 20 HES2-derived embryoid bodies. Scale bars, 50 μm. Rel., relative.
Figure 3
Figure 3
Enrichment of cardiomyocytes from hESC-derived cultures by cell sorting based on SIRPA expression. (a) Flow cytometric analysis of SIRPA expression in embryoid bodies at day (d)8, d12 and d20 of differentiation. FACS for SIRPA was performed at d8, d12 and d20. The unsorted, SIRPA+ and SIRPA fractions from each time point were analyzed for cTNT expression by intracellular flow cytometry. The frequency of cTNT+ cells at d8, d12 and d20 was significantly higher in the SIRPA+ fraction (d8: 95.2% ± 1.9, d12: 94.4 ± 1.7, d20: 89.6 ± 3.6), compared to SIRPA cells (d8: 13.0 ± 2.1, d12: 14.3 ± 3.9, d20: 15.7 ± 6.0, P ≤ 0.001). (b) Average enrichment of cTNT+ cells from three different cell separation experiments. Error bars represent s.e.m. Asterisks indicate statistical significance as determined by student’s t-test, ***, P ≤ 0.001. (c) QPCR analysis of unsorted, SIRPA+ and SIRPA cells. Expression of SIRPA, NKX2-5, MYH6, MYH7 and MYL7 was significantly higher in the SIRPA+ fraction compared to SIRPA fraction at all stages analyzed (d8, d12 and d20). Expression of markers for the noncardiac lineages (PECAM and DDR2) segregated to the SIRPA fraction. Error bars represent s.e.m. Asterisks indicate statistical significance as determined by student’s t-test. *, P ≤ 0.05; **, P ≤ 0.01; ***, P ≤ 0.001; n = 3. (d) Immunostaining of cTNI on monolayer cultures generated from unsorted, SIRPA+ and SIRPA cells sorted on day 20. Scale bars, 200 μm.
Figure 4
Figure 4
Enrichment of cardiomyocytes from hiPSC-derived cultures by cell sorting based on SIRPA expression. (a) Flow cytometric analysis of SIRPA expression at d20 of differentiation on 38-2 and MSC-iPS1 hiPSC-derived cells. FACS for SIRPA was performed on d20 and the unsorted, SIRPA+ and SIRPA fractions were analyzed for cTNT expression by intracellular flow cytometry. (b) The frequency of cTNT+ cells was significantly higher in the SIRPA+ fraction of both hiPSC-derived cultures (MSC-iPS1: 67.0 ± 3.6, 38-2: 71.4 ± 3.8), compared to SIRPA cells (MSC-iPS1: 4.9 ± 2.1; 38-2: 6.2 ± 0.9). Error bars represent s.e.m. Asterisks indicate statistical significance as determined by student’s t-test. **, P ≤ 0.01; ***, P ≤ 0.001; n = 3. (c) QPCR analysis of unsorted, SIRPA+ and SIRPA cells isolated from MSC-iPS1 and 38-2 hiPSC-derived day 20 cultures. Expression of markers specific for the cardiac lineage (SIRPA, NKX2-5, MYH6, MYH7, MYL2 and MYL7) was significantly higher in the SIRPA+ compared to the SIRPA fraction. Expression of markers for the noncardiac lineages (PDGFRB and NEUROD1) segregated to the SIRPA fraction and the PS cells. Error bars represent s.e.m. Asterisks indicate statistical significance as determined by student’s t-test. *, P ≤ 0.05; **, P ≤ 0.01; ***, P ≤ 0.001; n = 5.
Figure 5
Figure 5
Expression of SIRPA on human fetal cardiomyocytes and in adult human heart. (a) RT-qPCR analysis for SIRPA in human fetal heart tissue and adult heart. LV, left ventricle; RV, right ventricle; AP, Apex; LA, left atria; RA, right atria, AVJ, atrioventricular junction; AH, adult heart; d20, day 20 embryoid bodies, day 0, hESCs; HEK, human embryonic kidney cells; RT, reverse transcriptase control. Error bars represent s.e.m., n = 6. (b) Immunostaining for SIRPA (green) on human fetal ventricular cells and staining with MitoTracker Red. (c) Flow cytometric analysis for SIRPA on human fetal heart tissue. (d) Intracellular flow cytometric analysis for cTNT on human fetal heart tissue.
Figure 6
Figure 6
Using SIRPA to predict cardiac differentiation efficiency. (a) Day 5 KDR/PDGFRA flow cytometry profiles of cells from cardiac differentiation cultures induced with varying combinations of activin A (A0, 3, 6, 9 ng/ml) and BMP4 (B10, 30 ng/ml). The KDR+PDGFRA+ population has been shown to contain cardiac mesoderm cells. (b) Day 9 SIRPA flow cytometric analysis expression profiles of the cultures described in a. (c) Day 20 cTNT profiles (intracellular flow cytometric analysis) of the cultures described in a. (d) Quantification of ac. Close correlation of expression of SIRPA on day 9 (green dots) and cTNT expression on day 20 (red rhombuses) illustrates the predictive potential of SIRPA for cardiac differentiation efficiency.
Figure 7
Figure 7
Enrichment of cardiomyocytes through negative selection. (a) Flow cytometric analysis of markers specifically expressed on nonmyocyte (SIRPA-negative) cells in day 20 differentiation cultures (HES2). (b) FACS for the combination of markers specifically expressed on nonmyocyte cells (in PE: CD31, CD90, CD140B, CD49A). (c) Flow cytometric analysis of the unsorted cells, PE-negative (LIN) and PE-positive (LIN+) samples for SIRPA. (d) Quantification of nonmyocyte markers on day 20 of differentiation (as shown in a), n = 4. (e) Quantification of SIRPA+ cells in PS, LIN and LIN+ fractions after cell sorting. Asterisks indicate statistical significance as determined by student’s t-test, ***, P ≤ 0.001; n = 3. (f) QPCR analysis of the unsorted, LIN and LIN+ samples for noncardiac markers (PECAM1, PDGFRB, THY1 and DDR2) and cardiac specific genes (SIRPA, NKX2-5, MYH6 and MYH7). Error bars represent s.e.m. Asterisks indicate statistical significance as determined by student’s t-test, **, P ≤ 0.01; ***, P ≤ 0.001; n = 3. Expr., expression.

References

    1. Murry CE, Keller G. Differentiation of embryonic stem cells to clinically relevant populations: lessons from embryonic development. Cell. 2008;132:661–680. - PubMed
    1. Kattman SJ, et al. Stage-specific optimization of activin/nodal and BMP signaling promotes cardiac differentiation of mouse and human pluripotent stem cell lines. Cell Stem Cell. 2011;8:228–240. - PubMed
    1. Yang L, et al. Human cardiovascular progenitor cells develop from a KDR+ embryonic-stem-cell-derived population. Nature. 2008;453:524–528. - PubMed
    1. Zwi L, et al. Cardiomyocyte differentiation of human induced pluripotent stem cells. Circulation. 2009;120:1513–1523. - PubMed
    1. Braam SR, Passier R, Mummery CL. Cardiomyocytes from human pluripotent stem cells in regenerative medicine and drug discovery. Trends Pharmacol Sci. 2009;30:536–545. - PubMed

Publication types

MeSH terms