. 2012 Jan;194(1):28-35.
doi: 10.1128/JB.05932-11. Epub 2011 Oct 21.

ppGpp and polyphosphate modulate cell cycle progression in Caulobacter crescentus

Affiliations

ppGpp and polyphosphate modulate cell cycle progression in Caulobacter crescentus

Cara C Boutte et al. J Bacteriol. 2012 Jan.

Abstract

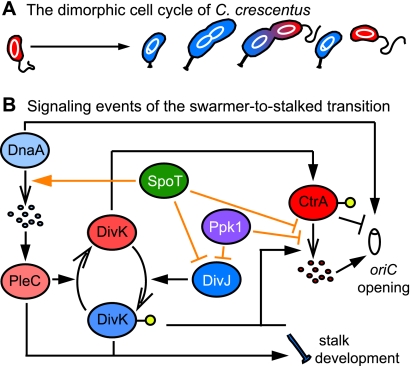
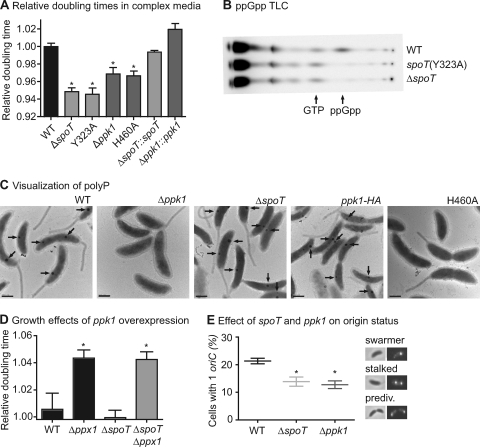
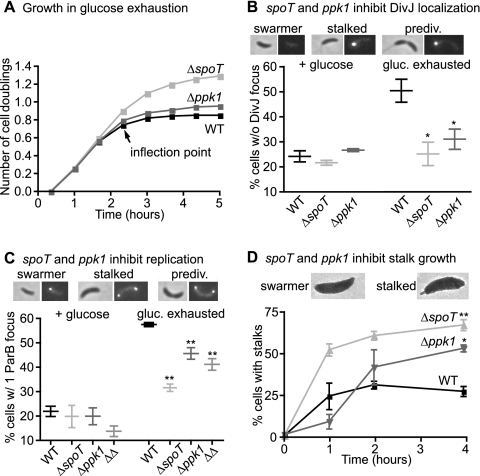
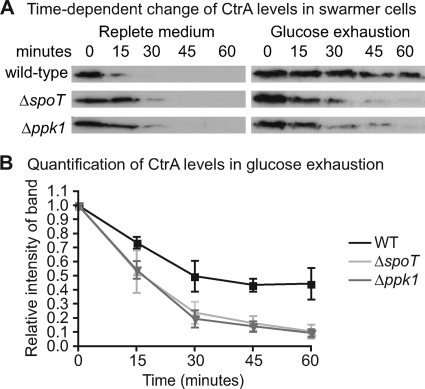
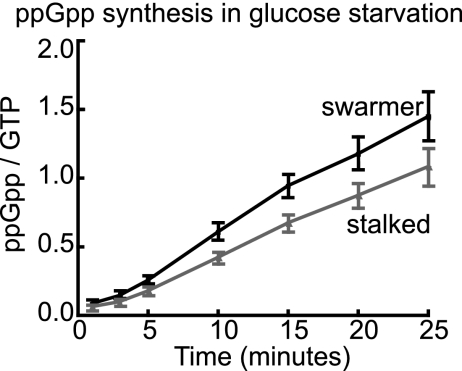
Caulobacter crescentus differentiates from a motile, foraging swarmer cell into a sessile, replication-competent stalked cell during its cell cycle. This developmental transition is inhibited by nutrient deprivation to favor the motile swarmer state. We identify two cell cycle regulatory signals, ppGpp and polyphosphate (polyP), that inhibit the swarmer-to-stalked transition in both complex and glucose-exhausted media, thereby increasing the proportion of swarmer cells in mixed culture. Upon depletion of available carbon, swarmer cells lacking the ability to synthesize ppGpp or polyP improperly initiate chromosome replication, proteolyze the replication inhibitor CtrA, localize the cell fate determinant DivJ, and develop polar stalks. Furthermore, we show that swarmer cells produce more ppGpp than stalked cells upon starvation. These results provide evidence that ppGpp and polyP are cell-type-specific developmental regulators.


Figures

Fig 1
Fig 1
Important signaling events of the swarmer-to-stalked transition. (A) Morphological progression of the C. crescentus cell cycle. Swarmer cells are shown in red; stalked cells are shown in blue. The chromosome is white. (B) Reduced model of the signaling events of the swarmer-to-stalked transition. Proteins that promote swarmer cell identity are shades of red; proteins that promote stalked-cell identity are shades of blue. Filled arrowheads indicate signal activation. Open arrowheads indicate physical transitions such as proteolysis (group of ovals) or phosphorylation (yellow circles). Perpendicular lines represent signal inhibition. Black lines indicate signaling events that occur during normal cell cycle progression in nutrient-replete medium; orange lines indicate signaling events that occur during nutrient limitation. Signaling events may be direct or indirect.
Fig 2
Fig 2
ppGpp and polyP lengthen the swarmer stage in complex medium. (A) Relative doubling times of strains growing in complex medium. Shown are normalized doubling times of wild-type (WT), ΔspoT, Δppk1, and point mutant strains and ΔspoT::spoT and Δppk1::ppk1 complemented strains (Table 1) (see Materials and Methods for information on growth conditions and data analysis) (n = 4). Error bars represent standard errors of the means. All normalized doubling times are compared to the wild-type control (one-way analysis of variance [ANOVA]; Dunnetts's posttest; ∗, P < 0.01). (B) TLC showing 32P-labeled spots of nucleotides extracted from glucose-starved wild-type, spoT(Y323A), and ΔspoT strains. (C) Transmission electron micrographs of unstained cells grown in glucose exhaustion conditions for 5 h. Dark granules containing polyP (8) are marked with arrows. Bars, 500 nm. (D) Doubling times of strains overexpressing ppk1 from the xylX promoter, normalized to their respective empty-vector control strains (Table 1). Growth was measured in PYE supplemented with 0.3% xylose (n = 3). Error bars represent standard errors of the means. Each strain overexpressing ppk1 was compared to its respective empty-vector control (one-way ANOVA; Bonferroni's posttest; ∗, P < 0.001). (E) Percentages of cells with a single origin of replication in mixed cultures growing in PYE, as quantified by counting tetR-YFP–oriC::tetO foci (Table 1). Representative images of fluorescent oriC from swarmer, stalked, and predivisional cells are at the right. The central bar indicates the mean value of the replicates (n = 3); error bars represent standard errors of the means. Each strain is compared to the wild type (one-way ANOVA; Dunnett's posttest; ∗, P < 0.05).
Fig 3
Fig 3
ppGpp and polyP contribute to swarmer accumulation during glucose exhaustion. (A) Number of cell doublings, determined by measuring OD660, in wild-type, ΔspoT, and Δppk1 strains after transfer to glucose exhaustion medium (M2G1/10). The labeled inflection point indicates the time at which experiments in panel D and Fig. 4A (right) and B commenced (n = 3; error bars representing standard errors of the means are plotted but are too small to see). (B and C) Percentages of cells without a DivJ-YFP focus (B) and with a single CFP-ParB focus (C) during log phase growth in M2G (+ glucose) and 5 h after the switch to M2G1/10 (gluc. exhausted). Micrographs showing DivJ-YFP fluorescence (B) and CFP-ParB fluorescence (C) in representative swarmer, stalked, and predivisional cells are shown at the top. ΔΔ represents the ΔspoT Δppk1 strain. Strains are compared to glucose-exhausted wild-type control (one-way ANOVA; Dunnett's posttest; n = 3). ∗, P < 0.05; ∗∗, P < 0.01. (D) Percentages of swarmer cells that develop stalks during glucose exhaustion. Cells were imaged by electron microscopy at 0, 1, 2, and 4 h after synchrony at the inflection point of glucose exhaustion (n = 2; 170 to 400 cells for each replicate). Strains are compared to the wild type at the 4-h time point (one-way ANOVA; Tukey's posttest; ∗, P < 0.05; ∗∗, P < 0.01). Electron micrographs of a swarmer cell and a nascent stalked cell are shown at the top. Bars and points indicate mean values of replicates; error bars indicate standard errors of the means.
Fig 4
Fig 4
Regulation of CtrA levels in swarmer cells. (A, left) Anti-CtrA Western blots from a population of synchronized swarmer cells in nutrient-replete (M2G) medium. (Right) Anti-CtrA blots from a population of synchronized swarmer cells under glucose exhaustion conditions. See Fig. S1B in the supplemental material for images of a loading control band under each tested condition. The glucose exhaustion experiment was conducted in triplicate; representative blots are shown. (B) Quantification of CtrA levels in swarmer cells during glucose exhaustion from three independent experiments. For each strain, the signal intensity for each band was normalized to the signal intensity of the first time point.
Fig 5
Fig 5
ppGpp accumulation in response to starvation in swarmer versus stalked cells. Mixed cultures were labeled with KH232PO4. The swarmer and stalked-cell bands were separated in a Percoll gradient, washed separately, and then resuspended in M2 defined medium lacking glucose. Samples were extracted, and nucleotides were resolved by TLC at time points after starvation (n = 6; linear regression; P < 0.01). Error bars represent standard errors of the means.

References

    1. Ahn K, Kornberg A. 1990. Polyphosphate kinase from Escherichia coli. Purification and demonstration of a phosphoenzyme intermediate. J. Biol. Chem. 265:11734–11739 - PubMed
    1. Berne C, Kysela DT, Brun YV. 2010. A bacterial extracellular DNA inhibits settling of motile progeny cells within a biofilm. Mol. Microbiol. 77:815–829 - PMC - PubMed
    1. Biondi EG, et al. 2006. Regulation of the bacterial cell cycle by an integrated genetic circuit. Nature 444:899–904 - PubMed
    1. Boutte CC, Crosson S. 2011. The complex logic of stringent response regulation in Caulobacter crescentus: starvation signalling in an oligotrophic environment. Mol. Microbiol. 80:695–714 - PMC - PubMed
    1. Britos L, et al. 2011. Regulatory response to carbon starvation in Caulobacter crescentus. PLoS One 6:e18179. - PMC - PubMed

Publication types

MeSH terms

LinkOut - more resources