

Altered glutathione homeostasis in heart augments cardiac lipotoxicity associated with diet-induced obesity in mice
- PMID: 22021075
- PMCID: PMC3234958
- DOI: 10.1074/jbc.M111.304592
Altered glutathione homeostasis in heart augments cardiac lipotoxicity associated with diet-induced obesity in mice
Abstract
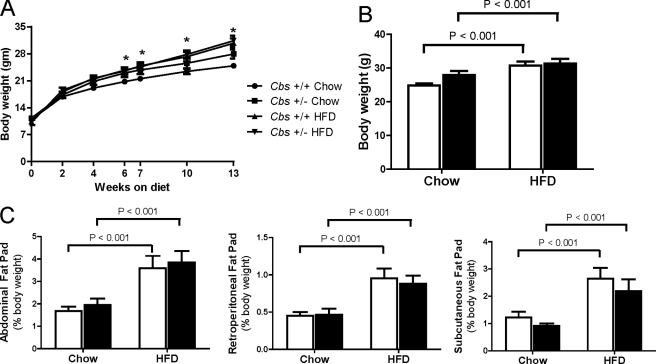
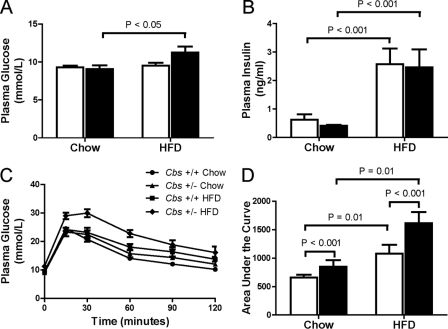
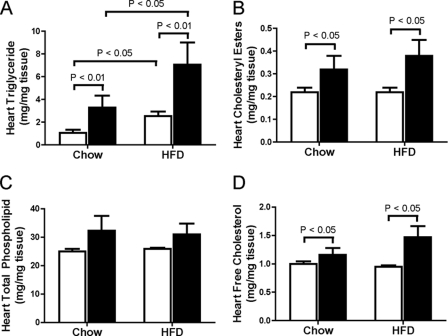
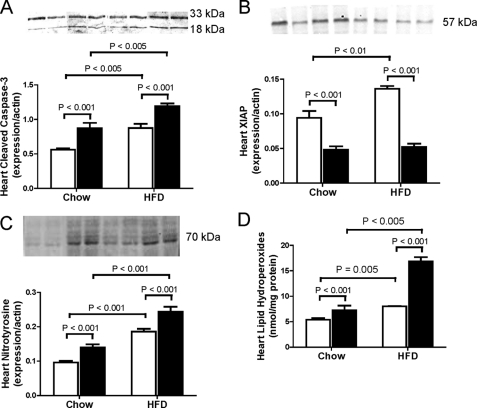
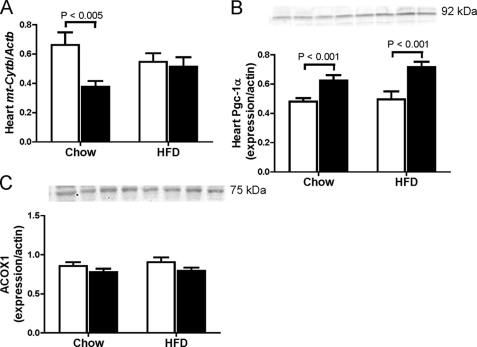
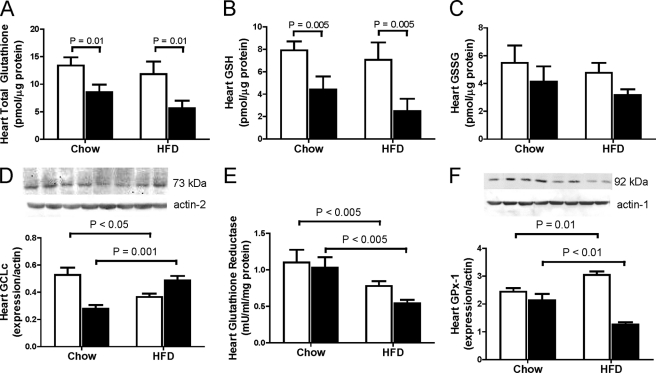
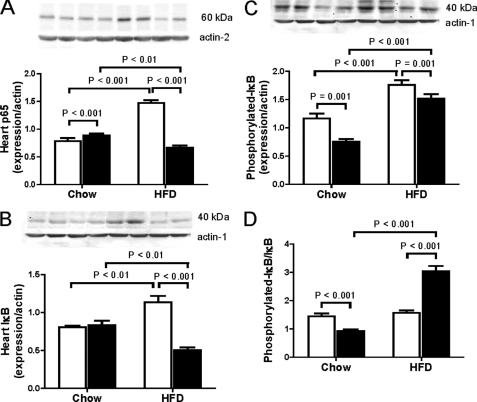
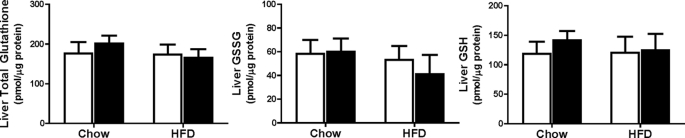
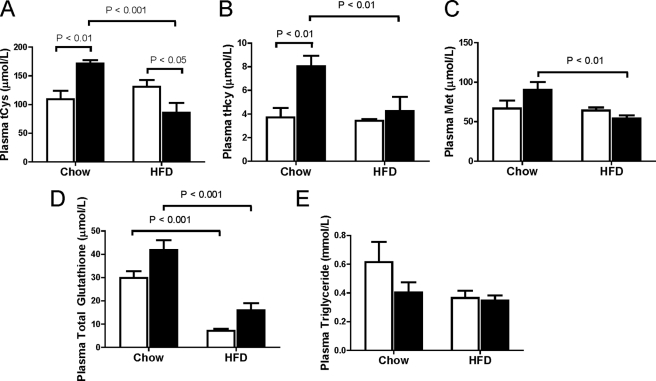
Obesity-related cardiac lipid accumulation is associated with increased myocardial oxidative stress. The role of the antioxidant glutathione in cardiac lipotoxicity is unclear. Cystathionine β-synthase (Cbs) catalyzes the first step in the trans-sulfuration of homocysteine to cysteine, which is estimated to provide ∼50% of cysteine for hepatic glutathione biosynthesis. As cardiac glutathione is a reflection of the liver glutathione pool, we hypothesize that mice heterozygous for targeted disruption of Cbs (Cbs(+/-)) are more susceptible to obesity-related cardiolipotoxicity because of impaired liver glutathione synthesis. Cbs(+/+) and Cbs(+/-) mice were fed a high fat diet (60% energy) from weaning for 13 weeks to induce obesity and had similar increases in body weight and body fat. This was accompanied by increased hepatic triglyceride but no differences in hepatic glutathione levels compared with mice fed chow. However, Cbs(+/-) mice with diet-induced obesity had greater glucose intolerance and lower total and reduced glutathione levels in the heart, accompanied by lower plasma cysteine levels compared with Cbs(+/+) mice. Higher triglyceride concentrations, increased oxidative stress, and increased markers of apoptosis were also observed in heart from Cbs(+/-) mice with diet-induced obesity compared with Cbs(+/+) mice. This study suggests a novel role for Cbs in maintaining the cardiac glutathione pool and protecting against cardiac lipid accumulation and oxidative stress during diet-induced obesity in mice.
Figures
Similar articles
-
Taurine-deficient diet up-regulated cystathionine beta-synthase monoallele in hemizygous cystathionine beta-synthase knockout mice.Nutr Res. 2009 Nov;29(11):794-801. doi: 10.1016/j.nutres.2009.10.005. Nutr Res. 2009. PMID: 19932868
-
High-fat diet stimulates hepatic cystathionine β-synthase and cystathionine γ-lyase expression.Can J Physiol Pharmacol. 2013 Nov;91(11):913-9. doi: 10.1139/cjpp-2013-0106. Epub 2013 Jun 13. Can J Physiol Pharmacol. 2013. PMID: 24117258
-
Perturbations in homocysteine-linked redox homeostasis in a murine model for hyperhomocysteinemia.Am J Physiol Regul Integr Comp Physiol. 2004 Jul;287(1):R39-46. doi: 10.1152/ajpregu.00036.2004. Epub 2004 Mar 11. Am J Physiol Regul Integr Comp Physiol. 2004. PMID: 15016621
-
Exendin-4 regulates redox homeostasis in rats fed with high-fat diet.Acta Biochim Biophys Sin (Shanghai). 2015 Jun;47(6):397-403. doi: 10.1093/abbs/gmv027. Epub 2015 Apr 23. Acta Biochim Biophys Sin (Shanghai). 2015. PMID: 25910576
-
The effect of dietary modulation of sulfur amino acids on cystathionine β synthase-deficient mice.Ann N Y Acad Sci. 2016 Jan;1363(1):80-90. doi: 10.1111/nyas.12967. Epub 2015 Nov 24. Ann N Y Acad Sci. 2016. PMID: 26599618 Free PMC article. Review.
Cited by
-
Progesterone receptor membrane component 1 reduces cardiac steatosis and lipotoxicity via activation of fatty acid oxidation and mitochondrial respiration.Sci Rep. 2021 Apr 22;11(1):8781. doi: 10.1038/s41598-021-88251-2. Sci Rep. 2021. PMID: 33888830 Free PMC article.
-
Hyperhomocysteinemia-Induced Alterations in Protein Expression and Oxidative Stress Parameters in Rat Heart.Physiol Res. 2024 Aug 31;73(4):515-527. doi: 10.33549/physiolres.935280. Physiol Res. 2024. PMID: 39264075 Free PMC article.
-
Short term exercise induces PGC-1α, ameliorates inflammation and increases mitochondrial membrane proteins but fails to increase respiratory enzymes in aging diabetic hearts.PLoS One. 2013 Aug 1;8(8):e70248. doi: 10.1371/journal.pone.0070248. Print 2013. PLoS One. 2013. PMID: 23936397 Free PMC article.
-
Inhibition of galectin-3 ameliorates the consequences of cardiac lipotoxicity in a rat model of diet-induced obesity.Dis Model Mech. 2018 Feb 5;11(2):dmm032086. doi: 10.1242/dmm.032086. Dis Model Mech. 2018. PMID: 29361517 Free PMC article.
-
The Interaction between Mitochondrial Oxidative Stress and Gut Microbiota in the Cardiometabolic Consequences in Diet-Induced Obese Rats.Antioxidants (Basel). 2020 Jul 21;9(7):640. doi: 10.3390/antiox9070640. Antioxidants (Basel). 2020. PMID: 32708095 Free PMC article.
References
-
- Szczepaniak L. S., Victor R. G., Orci L., Unger R. H. (2007) Circ. Res. 101, 759–767 - PubMed
-
- Unger R. H. (2002) Annu. Rev. Med. 53, 319–336 - PubMed
-
- Keaney J. F., Jr., Larson M. G., Vasan R. S., Wilson P. W., Lipinska I., Corey D., Massaro J. M., Sutherland P., Vita J. A., Benjamin E. J. (2003) Arterioscler. Thromb. Vasc. Biol. 23, 434–439 - PubMed
-
- Sies H. (1999) Free Radic. Biol. Med. 27, 916–921 - PubMed
Publication types
MeSH terms
Substances
Grants and funding
LinkOut - more resources
Full Text Sources
Medical
Molecular Biology Databases
Research Materials
