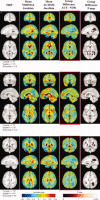
Brain growth rate abnormalities visualized in adolescents with autism
- PMID: 22021093
- PMCID: PMC4144412
- DOI: 10.1002/hbm.21441
Brain growth rate abnormalities visualized in adolescents with autism
Abstract
Autism spectrum disorder is a heterogeneous disorder of brain development with wide ranging cognitive deficits. Typically diagnosed before age 3, autism spectrum disorder is behaviorally defined but patients are thought to have protracted alterations in brain maturation. With longitudinal magnetic resonance imaging (MRI), we mapped an anomalous developmental trajectory of the brains of autistic compared with those of typically developing children and adolescents. Using tensor-based morphometry, we created 3D maps visualizing regional tissue growth rates based on longitudinal brain MRI scans of 13 autistic and seven typically developing boys (mean age/interscan interval: autism 12.0 ± 2.3 years/2.9 ± 0.9 years; control 12.3 ± 2.4/2.8 ± 0.8). The typically developing boys demonstrated strong whole brain white matter growth during this period, but the autistic boys showed abnormally slowed white matter development (P = 0.03, corrected), especially in the parietal (P = 0.008), temporal (P = 0.03), and occipital lobes (P = 0.02). We also visualized abnormal overgrowth in autism in gray matter structures such as the putamen and anterior cingulate cortex. Our findings reveal aberrant growth rates in brain regions implicated in social impairment, communication deficits and repetitive behaviors in autism, suggesting that growth rate abnormalities persist into adolescence. Tensor-based morphometry revealed persisting growth rate anomalies long after diagnosis, which has implications for evaluation of therapeutic effects.
Copyright © 2011 Wiley Periodicals, Inc.
Figures


Similar articles
-
Age-related temporal and parietal cortical thinning in autism spectrum disorders.Brain. 2010 Dec;133(Pt 12):3745-54. doi: 10.1093/brain/awq279. Epub 2010 Oct 5. Brain. 2010. PMID: 20926367 Free PMC article.
-
Longitudinal changes in cortical thickness in autism and typical development.Brain. 2014 Jun;137(Pt 6):1799-812. doi: 10.1093/brain/awu083. Epub 2014 Apr 22. Brain. 2014. PMID: 24755274 Free PMC article.
-
Mapping brain abnormalities in boys with autism.Hum Brain Mapp. 2009 Dec;30(12):3887-900. doi: 10.1002/hbm.20814. Hum Brain Mapp. 2009. PMID: 19554561 Free PMC article.
-
[Structural and functional neuroanatomy of attention-deficit hyperactivity disorder (ADHD)].Encephale. 2009 Apr;35(2):107-14. doi: 10.1016/j.encep.2008.01.005. Epub 2008 Jul 7. Encephale. 2009. PMID: 19393378 Review. French.
-
Bridging the gap between MRI and postmortem research in autism.Brain Res. 2011 Mar 22;1380:175-86. doi: 10.1016/j.brainres.2010.09.061. Epub 2010 Sep 22. Brain Res. 2011. PMID: 20869352 Free PMC article. Review.
Cited by
-
Fusiform correlates of facial memory in autism.Behav Sci (Basel). 2013;3(3):348-71. doi: 10.3390/bs3030348. Behav Sci (Basel). 2013. PMID: 24761228 Free PMC article.
-
Altered resting perfusion and functional connectivity of default mode network in youth with autism spectrum disorder.Brain Behav. 2015 Sep;5(9):e00358. doi: 10.1002/brb3.358. Epub 2015 Jun 25. Brain Behav. 2015. PMID: 26445698 Free PMC article.
-
Effects of Dance Movement Therapy on Adult Patients with Autism Spectrum Disorder: A Randomized Controlled Trial.Behav Sci (Basel). 2018 Jun 29;8(7):61. doi: 10.3390/bs8070061. Behav Sci (Basel). 2018. PMID: 29966313 Free PMC article.
-
An altered scaffold for information processing: Cognitive control development in adolescents with autism.Biol Psychiatry Cogn Neurosci Neuroimaging. 2017 Sep;2(6):464-475. doi: 10.1016/j.bpsc.2017.06.002. Biol Psychiatry Cogn Neurosci Neuroimaging. 2017. PMID: 28924621 Free PMC article.
-
Somatic overgrowth predisposes to seizures in autism spectrum disorders.PLoS One. 2013 Sep 23;8(9):e75015. doi: 10.1371/journal.pone.0075015. eCollection 2013. PLoS One. 2013. PMID: 24086423 Free PMC article.
References
-
- Akshoomoff N, Lord C, Lincoln AJ, Courchesne RY, Carper RA, Townsend J, Courchesne E ( 2004): Outcome classification of preschool children with autism spectrum disorders using MRI brain measures. J Am Acad Child Adolesc Psychiatry 43: 349–357. - PubMed
-
- Amaral DG, Schumann CM, Nordahl CW ( 2008): Neuroanatomy of autism. Trends Neurosci 31: 137–145. - PubMed
-
- Ashburner J, Friston KJ ( 2003): Morphometry. Human Brain Function, 2nd ed San Diego: Academic Press; pp 707–724.
-
- Bachevalier J, Loveland KA ( 2006): The orbitofrontal‐amygdala circuit and self‐regulation of social‐emotional behavior in autism. Neurosci Biobehav Rev 30: 97–117. - PubMed
-
- Bailey A, Le Couteur A, Gottesman I, Bolton P, Simonoff E, Yuzda E, Rutter M ( 1995): Autism as a strongly genetic disorder: Evidence from a British twin study. Psychol Med 25: 63–77. - PubMed
Publication types
MeSH terms
Grants and funding
- R01 NS046018/NS/NINDS NIH HHS/United States
- 5R01 NS046018/NS/NINDS NIH HHS/United States
- R01 MH067187/MH/NIMH NIH HHS/United States
- R01 NS032070/NS/NINDS NIH HHS/United States
- M01 RR000865/RR/NCRR NIH HHS/United States
- R01 EB007/EB/NIBIB NIH HHS/United States
- P41 RR013642/RR/NCRR NIH HHS/United States
- R01 AG020098/AG/NIA NIH HHS/United States
- 5K08 MH01385/MH/NIMH NIH HHS/United States
- R01 EB007813/EB/NIBIB NIH HHS/United States
- R01 HD050735/HD/NICHD NIH HHS/United States
- R01 EB008432/EB/NIBIB NIH HHS/United States
- NS32070/NS/NINDS NIH HHS/United States
- U54 RR021813/RR/NCRR NIH HHS/United States
- R01 EB008281/EB/NIBIB NIH HHS/United States
- MH067187;/MH/NIMH NIH HHS/United States
LinkOut - more resources
Full Text Sources

