. 2011 Dec;157(4):2216-26.
doi: 10.1104/pp.111.187773. Epub 2011 Oct 21.

The extent to which methyl salicylate is required for signaling systemic acquired resistance is dependent on exposure to light after infection

Affiliations

The extent to which methyl salicylate is required for signaling systemic acquired resistance is dependent on exposure to light after infection

Po-Pu Liu et al. Plant Physiol. 2011 Dec.

Abstract

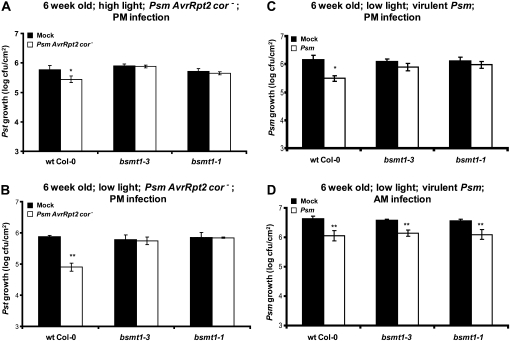
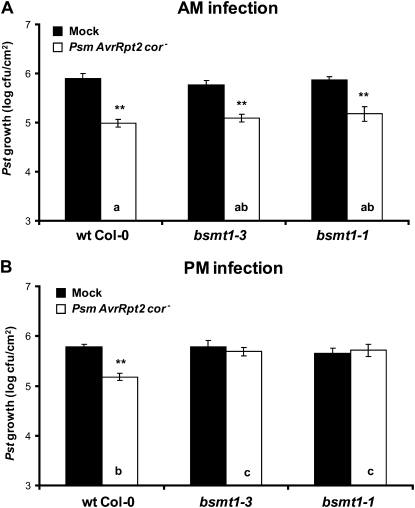
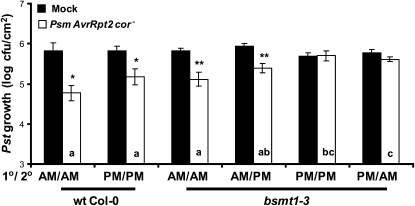
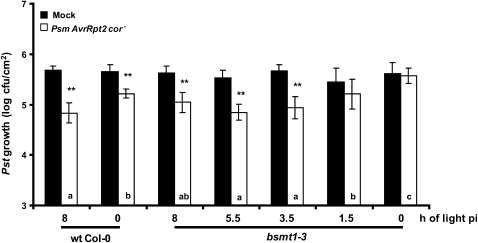
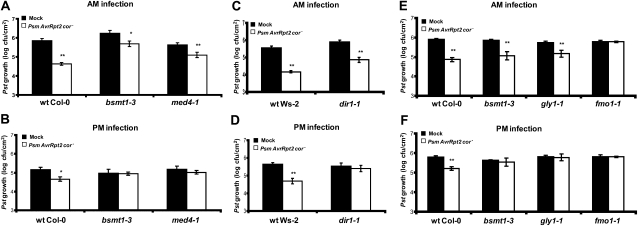
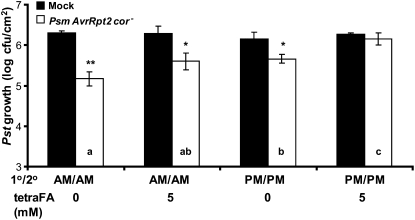
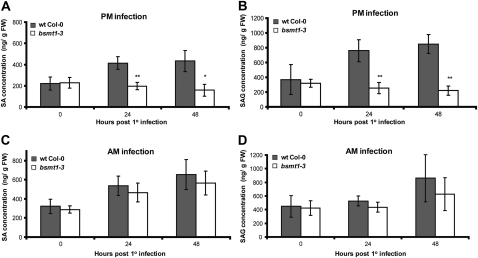
Systemic acquired resistance (SAR) is a state of heightened defense to a broad spectrum of pathogens that is activated throughout a plant following local infection. Development of SAR requires the translocation of one or more mobile signals from the site of infection through the vascular system to distal (systemic) tissues. The first such signal identified was methyl salicylate (MeSA) in tobacco (Nicotiana tabacum). Subsequent studies demonstrated that MeSA also serves as a SAR signal in Arabidopsis (Arabidopsis thaliana) and potato (Solanum tuberosum). By contrast, another study suggested that MeSA is not required for SAR in Arabidopsis and raised questions regarding its signaling role in tobacco. Differences in experimental design, including the developmental age of the plants, the light intensity, and/or the strain of bacterial pathogen, were proposed to explain these conflicting results. Here, we demonstrate that the length of light exposure that plants receive after the primary infection determines the extent to which MeSA is required for SAR signaling. When the primary infection occurred late in the day and as a result infected plants received very little light exposure before entering the night/dark period, MeSA and its metabolizing enzymes were essential for SAR development. In contrast, when infection was done in the morning followed by 3.5 h or more of exposure to light, SAR developed in the absence of MeSA. However, MeSA was generally required for optimal SAR development. In addition to resolving the conflicting results concerning MeSA and SAR, this study underscores the importance of environmental factors on the plant's response to infection.


Figures

Figure 1.
Figure 1.
Effects of different conditions on SAR development in wild-type and bsmt1 mutant plants. A and B, Growth of virulent Pst at 2 to 3 d post 2° inoculation on 6-week-old wild-type (wt) and bsmt1 mutant plants that were previously mock inoculated with MgCl2 (black bars) or inoculated with Psm AvrRpt2 cor (SAR induction; white bars). C and D, Growth of virulent Psm strain ES4326 at 2 to 3 d post 2° inoculation on 6-week-old wild-type and bsmt1 mutant plants previously mock inoculated or Psm infected. Photon flux density of 140 μE m−2 s−1 (high light) was used in A, while 70 μE m−2 s−1 (low light) was used in B through D. The 1° and 2° infections in D were done in the morning (9:00–9:30 am) versus in the late afternoon for A through C (5:30–6:00 pm). All experiments were done at least twice with similar results; means of three replicates ± sd are presented. Asterisks directly above each set of white/black bars indicate statistically significant differences (* P < 0.05, ** P < 0.01, Student’s t test) between Pst (or Psm) growth in plants induced for SAR by Psm AvrRpt2 cor (or Psm) versus growth on mock-inoculated controls for each genotype. Pst growth levels among the four panels cannot be compared, since the experiments were done separately over several weeks to months and basal resistance varies somewhat from experiment to experiment; thus, each experiment has an internal control. Note that the stronger SAR observed with low light (B) compared with high light (A) was not reproducible.
Figure 2.
Figure 2.
Time of infection during the day affects the requirement of MeSA for SAR development. The 1° and 2° infections of 3- to 4-week-old wild-type (wt) and bsmt1 mutant plants were done in the morning (A; 9:00–9:30 am) or late afternoon (B; 5:30–6:00 pm). Growth of Pst at 2 to 3 d post 2° inoculation from plants previously mock inoculated with MgCl2 (black bars) or infected with Psm AvrRpt2 cor (SAR induction; white bars) is presented. All experiments were done at least twice with similar results; means of three replicates ± sd are presented. Asterisks directly above each set of white/black bars indicate statistically significant differences (** P < 0.01, Student’s t test) between Pst growth in plants induced for SAR by Psm AvrRpt2 cor versus growth in mock-inoculated controls. Letters within the white bars indicate whether there was a statistically significant difference (P < 0.05) in Pst growth in Psm AvrRpt2 cor-inoculated wild-type and bsmt1-3 plants that were subjected to different times (am and pm) of inoculation, using ANOVA and posthoc tests. Bars with the same letter indicate no significant difference, while bars with different letters indicate significantly different levels of Pst growth.
Figure 3.
Figure 3.
MeSA-independent induction of SAR requires extended light exposure after the inducing 1° infection but not after the challenging 2° infection. Three- to four-week-old wild-type (wt) and bsmt1 mutant plants were subjected to 1° or 2° infection in either the morning (9:00–9:30 am) or late afternoon (5:30–6:00 pm). Growth of the virulent Pst at 2 d post 2° inoculation on wild-type and bsmt1 mutant plants previously mock inoculated with MgCl2 (black bars) or infected with Psm AvrRpt2 cor (SAR induction; white bars) is presented. The experiment was done twice with similar results; means of three replicates ± sd are presented. Asterisks directly above each set of white/black bars indicate statistically significant differences (* P < 0.05, ** P < 0.01, Student’s t test) between Pst growth in plants induced for SAR by Psm AvrRpt2 cor versus growth on mock-inoculated controls. Letters within the white bars indicate whether there was a statistically significant difference (P < 0.05) in Pst growth in Psm AvrRpt2 cor-inoculated wild-type and bsmt1-3 plants that were subjected to different times (am and pm) of inoculation, using ANOVA and posthoc tests. Bars with the same letter indicate no significant difference, while bars with different letters indicate significantly different levels of Pst growth.
Figure 4.
Figure 4.
The duration of light exposure after infection affects the requirement for MeSA during SAR development. Immediately following 1° and 2° inoculations, 3- to 4-week-old wild-type (wt) and bsmt1-3 plants were subjected to 8, 5.5, 3.5, 1.5, and 0 h of light. The growth of virulent Pst in uninoculated, distal tissues was monitored at 2 d post 2° inoculation in plants that previously received a mock inoculation with MgCl2 (black bars) or were infected with Psm AvrRpt2 cor (SAR induction; white bars). Means of six replicates ± sd of the combined results from two experiments are presented. Asterisks directly above each set of white/black bars indicate statistically significant differences (** P < 0.01, Student’s t test) between Pst growth in plants induced for SAR by Psm AvrRpt2 cor versus growth on mock-inoculated control plants for each genotype and duration of light exposure. Letters within the white bars indicate whether there was a statistically significant differences (P < 0.05) in Pst growth in Psm AvrRpt2 cor-inoculated wild-type and bsmt1-3 plants that were subjected to different times (am and pm) of inoculation, using ANOVA and posthoc tests. Bars with the same letter indicate no significant difference, while bars with different letters indicate significantly different levels of Pst growth.
Figure 5.
Figure 5.
Characterization of light-dependent induction of SAR in wild-type plants and SAR-deficient mutants bsmt1-3, med4-1, dir1-1, gly1-1, and fmo1-1. The 1° and 2° infections were done in the morning (9:00–9:30 am) or late afternoon (5:30–6:00 pm) in 3- to 4-week-old wild-type (wt), bsmt1-3, and med4-1 in which multiple MeSA esterases were silenced (A and B), dir1-1 (C and D), and gly1-1 and fmo1-1 (E and F). The bsmt1-3 mutant served as a control. Growth of the virulent Pst was determined at 2 to 3 d post 2° inoculation on wild-type and mutant plants previously mock inoculated with MgCl2 (black bars) or infected with Psm AvrRpt2 cor (SAR induction; white bars). All experiments were done twice with similar results; means of three replicates ± sd are presented. Asterisks directly above each set of white/black bars indicate statistically significant differences (* P < 0.05, ** P < 0.01, Student’s t test) between Pst growth in plants induced for SAR by Psm AvrRpt2 cor versus growth on mock-inoculated control plants for each genotype. Pst growth levels among the six panels cannot be compared, since experiments were done separately over several weeks to months and basal resistance varies somewhat from experiment to experiment; thus, each experiment has an internal control.
Figure 6.
Figure 6.
Suppression of SAR development by inhibition of MeSA esterase activity with the synthetic SA analog tetraFA is light dependent. Ten millimolar HEPES buffer (pH 7.0) with or without 5 mm tetraFA was applied to uninoculated, distal leaves of 3- to 4-week-old wild-type Col-0 at 24 and 48 h post 1° infection, which was done either in the morning (9:00–9:30 am) or late afternoon (5:30–6:00 pm). Growth of the virulent Pst at 3 d post 2° inoculation on plants previously mock inoculated with MgCl2 (black bars) or infected with Psm AvrRpt2 cor (SAR induction; white bars) is presented. The experiment was done twice with similar results; means of three replicates ± sd are presented. Asterisks directly above each set of white/black bars indicate statistically significant differences (* P < 0.05, ** P < 0.01, Student’s t test) between Pst growth in plants induced for SAR by Psm AvrRpt2 cor versus growth on mock-inoculated controls. Letters within the white bars indicate whether there was a statistically significant difference (P < 0.05) in Pst growth in Psm AvrRpt2 cor-inoculated plants that were subjected to different tetraFA treatments, using ANOVA and posthoc tests. Bars with the same letter indicate no significant difference, while bars with different letters indicate significantly different levels of Pst growth.
Figure 7.
Figure 7.
The effects of time of 1° infection on SA and SAG levels in the distal tissue. SA (A and C) and SAG (B and D) contents were quantified in uninoculated distal leaves of 3- to 4-week-old wild-type (wt) and bsmt1-3 plants infected in the morning (9:00–9:30 am) versus late afternoon (5:30–6:00 pm) with Psm AvrRpt2 cor. The experiments in A and B were done twice with similar results; means of three replicates ± sd are presented. The data presented in C and D (means of six replicates ± sd) are the combined results from two independent experiments, each of which gave similar results. Asterisks directly above each set of white/black bars indicate statistically significant differences (* P < 0.05, ** P < 0.01, Student’s t test) between levels in bsmt1-3 versus wild-type Col-0 for each time point. The levels of SA and SAG cannot be compared between am (A and B) and pm (C and D) infection, since the experiments were done several months apart and SA and SAG levels vary between experiments, thus requiring internal controls in each experiment. FW, Fresh weight.

References

    1. Attaran E, Zeier TE, Griebel T, Zeier J. (2009) Methyl salicylate production and jasmonate signaling are not essential for systemic acquired resistance in Arabidopsis. Plant Cell 21: 954–971 - PMC - PubMed
    1. Bartsch M, Gobbato E, Bednarek P, Debey S, Schultze JL, Bautor J, Parker JE. (2006) Salicylic acid-independent ENHANCED DISEASE SUSCEPTIBILITY1 signaling in Arabidopsis immunity and cell death is regulated by the monooxygenase FMO1 and the Nudix hydrolase NUDT7. Plant Cell 18: 1038–1051 - PMC - PubMed
    1. Chanda B, Xia Y, Mandal MK, Yu K, Sekine KT, Gao QM, Selote D, Hu Y, Stromberg A, Navarre D, et al. (2011) Glycerol-3-phosphate is a critical mobile inducer of systemic immunity in plants. Nat Genet 43: 421–427 - PubMed
    1. Chandra-Shekara AC, Gupte M, Navarre D, Raina S, Raina R, Klessig D, Kachroo P. (2006) Light-dependent hypersensitive response and resistance signaling against Turnip crinkle virus in Arabidopsis. Plant J 45: 320–334 - PubMed
    1. Chaturvedi R, Krothapalli K, Makandar R, Nandi A, Sparks AA, Roth MR, Welti R, Shah J. (2008) Plastid omega3-fatty acid desaturase-dependent accumulation of a systemic acquired resistance inducing activity in petiole exudates of Arabidopsis thaliana is independent of jasmonic acid. Plant J 54: 106–117 - PubMed

Publication types

MeSH terms

LinkOut - more resources