Meta-Analysis
. 2012 Feb 1;21(3):711-20.
doi: 10.1093/hmg/ddr489. Epub 2011 Oct 21.

Genome-wide association study of body height in African Americans: the Women's Health Initiative SNP Health Association Resource (SHARe)

Affiliations
Meta-Analysis

Genome-wide association study of body height in African Americans: the Women's Health Initiative SNP Health Association Resource (SHARe)

Cara L Carty et al. Hum Mol Genet. .

Abstract

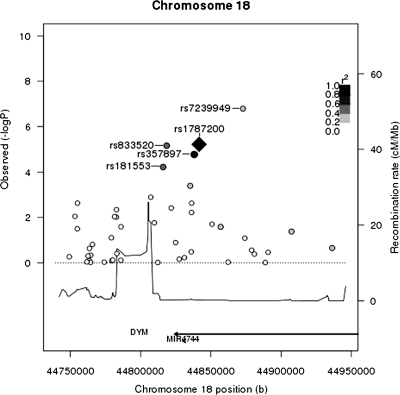
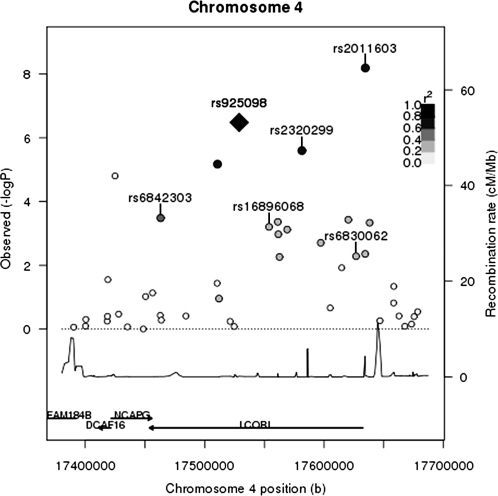
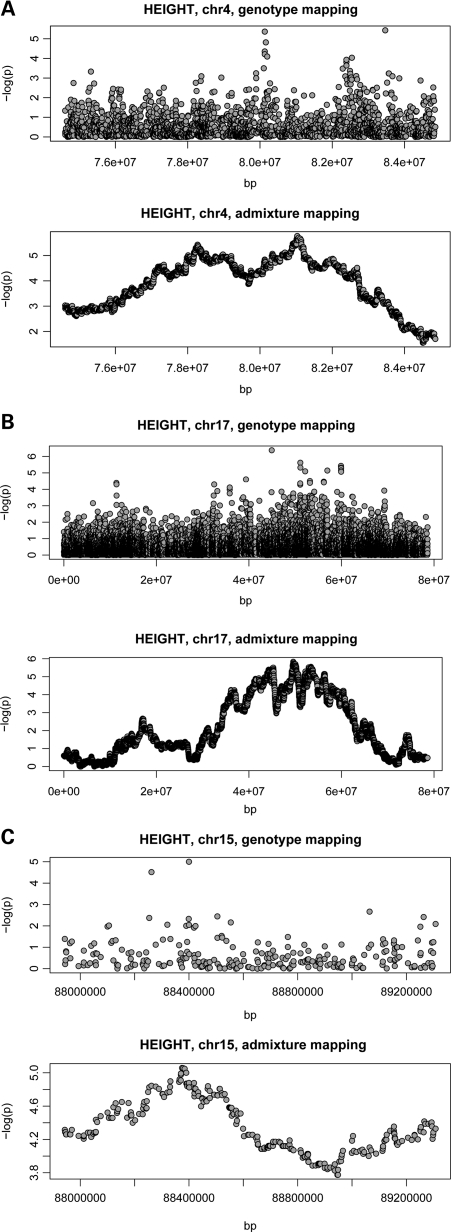
Height is a complex trait under strong genetic influence. To date, numerous genetic loci have been associated with height in individuals of European ancestry. However, few large-scale discovery genome-wide association studies (GWAS) of height in minority populations have been conducted and thus information about population-specific height regulation is limited. We conducted a GWA analysis of height in 8149 African-American (AA) women from the Women's Health Initiative. Genetic variants with P< 5 × 10(-5) (n = 169) were followed up in a replication data set (n = 20 809) and meta-analyzed in a total of 28 958 AAs and African-descent individuals. Twelve single-nucleotide polymorphisms (SNPs) representing 7 independent loci were significantly associated with height at P < 5 × 10(-8). We identified novel SNPs in 17q23 (TMEM100/PCTP) and Xp22.3 (ARSE) reflecting population-specific regulation of height in AAs and replicated five loci previously reported in European-descent populations [4p15/LCORL, 11q13/SERPINH1, 12q14/HMGA2, 17q23/MAP3K3 (mitogen-activated protein kinase3) and 18q21/DYM]. In addition, we performed an admixture mapping analysis of height which is both complementary and supportive to the GWA analysis and suggests potential associations between ancestry and height on chromosomes 4 (4q21), 15 (15q26) and 17 (17q23). Our findings provide insight into the genetic architecture of height and support the investigation of non-European-descent populations for identifying genetic factors associated with complex traits. Specifically, we identify new loci that may reflect population-specific regulation of height and report several known height loci that are important in determining height in African-descent populations.


Figures

Figure 1.
Figure 1.
Height association P-value and LD plot of the chromosome 18 DYM region P-values for WHI-only GWA results for SNPs within 150 kb of the top SNP from the replication, rs1787200, in the DYM region are shown. LD between rs1787200 and other SNPs in WHI is indicated using a gray scale, with black indicating the highest LD and white, the lowest LD. rs1787200 (black diamond) is in high LD with the other top DYM SNP from the replication meta-analysis, rs357897 (black circle). Top SNPs for the WHI-only analysis (rs7239949, rs833520 and rs181553) are also labeled.
Figure 2.
Figure 2.
Height association P-value and LD plot of the chromosome 17 TMEM100-PCTP region P-values for WHI-only GWA results for SNPs within 100 kb of the top hit in the TMEM100-PCTP region are shown. LD between rs1549519 and other SNPs in this region in the study population is indicated using a gray scale, with black indicating the highest LD and white, the lowest LD. rs1549519 (black diamond) is in high LD with the other top SNP from the replication meta-analysis, rs1426745.
Figure 3.
Figure 3.
Height association P-value and LD plot of the chromosome 4 LCORL region P-values for WHI-only GWA results within 150 kb of the top SNP identified in the replication meta-analysis, rs925098, in the LCORL region are shown. rs925098 is labeled with a black diamond. LD between rs925098 and other SNPs in this region in the WHI study population is indicated using a gray scale, with black indicating the highest LD and white, the lowest LD. SNPs in the region with modestly significant associations with height and in high LD (r2 > 0.6) with rs925098 include rs232099 and rs2011603. These data suggest that these three SNPs may not be independent. Other SNPs previously reported to be associated with height in European-descent populations (rs6842303, rs16896068 and rs6830062) are in lower LD with rs925098.
Figure 4.
Figure 4.
WHI admixture mapping results. A plot of admixture mapping −log10 P-value results in the WHI data set on chromosomes 1–22 and X is shown. Much like a Manhattan plot, P-values are plotted in order of SNP position on the chromosome. The tall peaks reaching P-values of <1 × 10⁻⁵ suggest that SNPs indicative of African ancestry on chromosomes 4, 12 and 17 are associated with height.
Figure 5.
Figure 5.
Comparison of GWA and admixture results in the WHI data set for chromosomal regions 4 (A), 17 (B) and 15 (C). In the WHI data set, GWA results for height are contrasted with height admixture mapping results for the same regions on the chromosome. Locations on the respective chromosome (in base pairs) are shown on the X-axes and −log10 P-values are indicated on the Y-axes.

References

    1. Perola M., Sammalisto S., Hiekkalinna T., Martin N.G., Visscher P.M., Montgomery G.W., Benyamin B., Harris J.R., Boomsma D., Willemsen G., et al. Combined genome scans for body stature in 6,602 European twins: evidence for common Caucasian loci. PLoS Genet. 2007;3:e97. - PMC - PubMed
    1. Sale M.M., Freedman B.I., Hicks P.J., Williams A.H., Langefeld C.D., Gallagher C.J., Bowden D.W., Rich S.S. Loci contributing to adult height and body mass index in African American families ascertained for type 2 diabetes. Ann. Hum. Genet. 2005;69:517–527. - PubMed
    1. Hirschhorn J.N., Lindgren C.M., Daly M.J., Kirby A., Schaffner S.F., Burtt N.P., Altshuler D., Parker A., Rioux J.D., Platko J., et al. Genomewide linkage analysis of stature in multiple populations reveals several regions with evidence of linkage to adult height. Am. J. Hum. Genet. 2001;69:106–116. - PMC - PubMed
    1. Weedon M.N., Frayling T.M. Reaching new heights: insights into the genetics of human stature. Trends Genet. 2008;24:595–603. - PubMed
    1. Weedon M.N., Lango H., Lindgren C.M., Wallace C., Evans D.M., Mangino M., Freathy R.M., Perry J.R., Stevens S., Hall A.S., et al. Genome-wide association analysis identifies 20 loci that influence adult height. Nat. Genet. 2008;40:575–583. - PMC - PubMed

Publication types