

Sample size tables for computer-aided detection studies
- PMID: 22021528
- PMCID: PMC3494304
- DOI: 10.2214/AJR.11.6764
Sample size tables for computer-aided detection studies
Abstract
Objective: Calculating the sample size for a multireader, multicase study of readers' diagnostic accuracy is complicated. Studies in which patients can have multiple findings, as is common in many computer-aided detection (CAD) studies, are particularly challenging to design.
Materials and methods: We modified existing methods for sample size estimation for multireader, multicase studies to accommodate multiple findings on the same case. We use data from two large multireader, multicase CAD studies as ballpark estimates of parameter values.
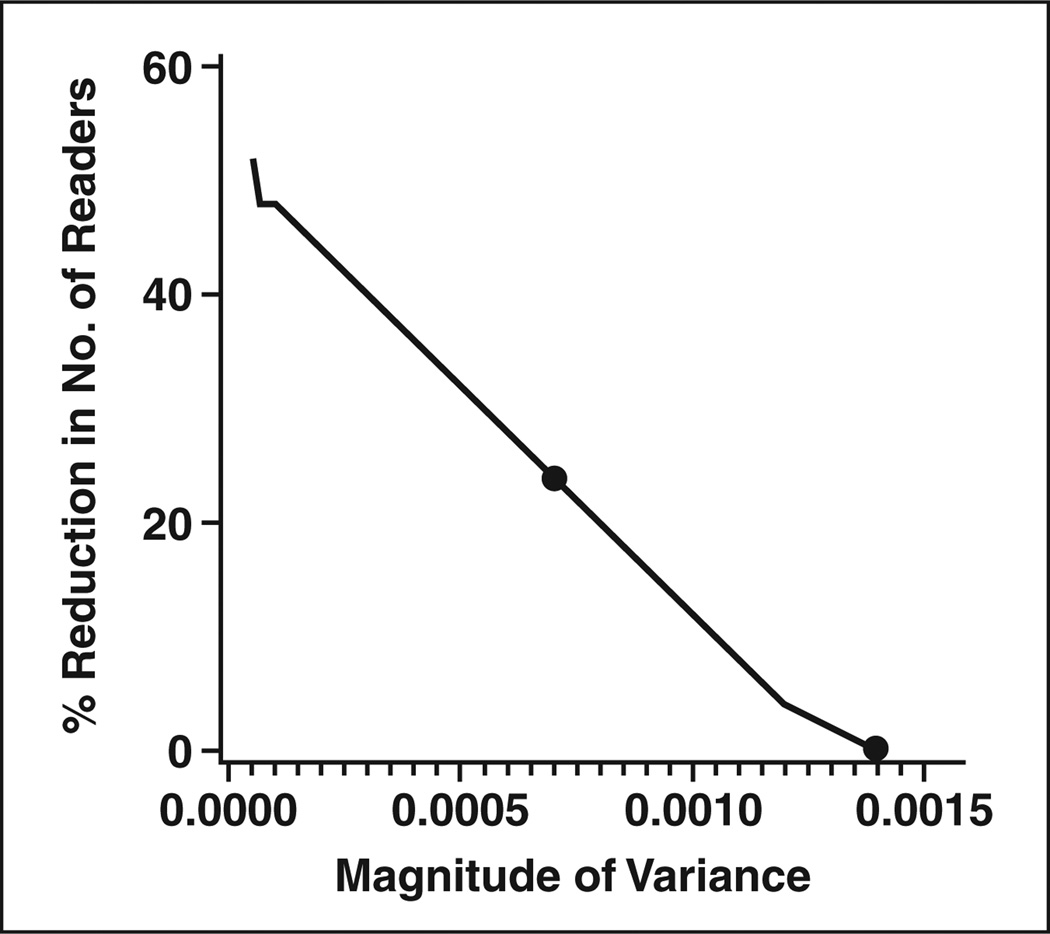
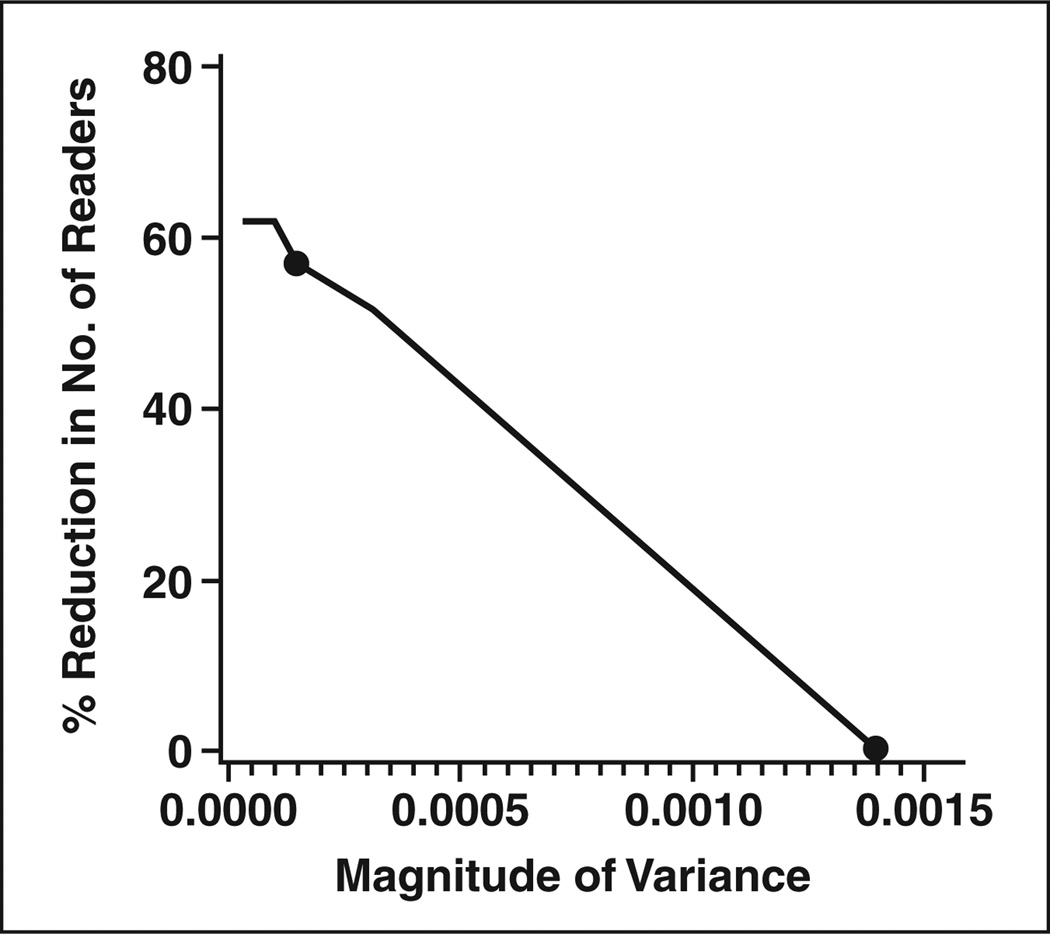
Results: Sample size tables are presented to provide an estimate of the number of patients and readers required for a multireader, multicase study with multiple findings per case; these estimates may be conservative for many CAD studies. Two figures can be used to adjust the number of readers when there is some data on the between-reader variability.
Conclusion: The sample size tables are useful in determining whether a proposed study is feasible with the available resources; however, it is important that investigators compute sample size for their particular study using any available pilot data.
Figures
References
-
- Dodd LE, Wagner RF, Armato SG, 3rd, et al. Lung Image Database Consortium Research Group. Assessment methodologies and statistical issues for computer-aided diagnosis of lung nodules in computed tomography: contemporary research topics relevant to the lung image database consortium. Acad Radiol. 2004;11:462–475. - PubMed
-
- Wagner RF, Beiden SV, Campbell G, Metz CE, Sacks WM. Assessment of medical imaging and computer-assist systems: lessons from recent experience. Acad Radiol. 2002;9:1264–1277. - PubMed
-
- Gur D, Zheng B, Fuhrman CR, Hardesty L. On the testing and reporting of computer-aided detection results for lung cancer detection. Radiology. 2004;232:5–6. - PubMed
-
- Wagner RF, Metz CE, Campbell G. Assessment of medical imaging systems and computer aids: a tutorial review. Acad Radiol. 2007;14:723–748. - PubMed
Publication types
MeSH terms
Grants and funding
LinkOut - more resources
Full Text Sources
Medical
Miscellaneous
