. 2011 Dec 1;187(11):5931-40.
doi: 10.4049/jimmunol.1101474. Epub 2011 Oct 21.

TOX is required for development of the CD4 T cell lineage gene program

Affiliations

TOX is required for development of the CD4 T cell lineage gene program

Parinaz Aliahmad et al. J Immunol. .

Abstract

The factors that regulate thymic development of the CD4(+) T cell gene program remain poorly defined. The transcriptional regulator ThPOK is a dominant factor in CD4(+) T cell development, which functions primarily to repress the CD8 lineage fate. Previously, we showed that nuclear protein TOX is also required for murine CD4(+) T cell development. In this study, we sought to investigate whether the requirement for TOX was solely due to a role in ThPOK induction. In apparent support of this proposition, ThPOK upregulation and CD8 lineage repression were compromised in the absence of TOX, and enforced ThPOK expression could restore some CD4 development. However, these "rescued" CD4 cells were defective in many aspects of the CD4(+) T cell gene program, including expression of Id2, Foxo1, and endogenous Thpok, among others. Thus, TOX is necessary to establish the CD4(+) T cell lineage gene program, independent of its influence on ThPOK expression.


Figures
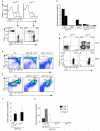
Figure 1
Figure 1
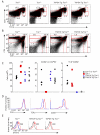
Lineage confusion in TOX-deficient T cells. A, Flow cytometry of splenocytes from Tox+/+ and Tox−/− mice stained for expression of TCRβ, CD4 and CD8α. Numbers indicate percentage of gated populations. Data are representative of at least ten experiments. B, Quantitative RT-PCR analysis of expression in purified splenic T cells from Tox+/+ and Tox−/− gated as in (A). Results are represented as relative to expression of Gapdh. Two independent experiments are shown. C, Flow cytometry of splenic T cells gated for expression of CD4 (top) or CD8 (bottom) from Tox+/+ and Tox−/− mice co-stained for CD103. Numbers indicate percentage of gated populations. Data are representative of three experiments. D-E Thymocytes from mice of the indicated genotype were immunostained for (D) CD4 and CD8 or (E) CD5 and TCRβ and analyzed by flow cytometry. Numbers indicate frequency (%) of cells in the adjacent gates. Data is representative of four animals. F, Comparison of Gata3 expression in AND-Tg Tox−/− and control (AND-Tg Tox+/+ or AND-Tg Tox+/−) thymocytes (data from three experiments are pooled). G, Comparison of Thpok expression in AND-Tg Tox−/−, control (AND-Tg Tox+/+ or AND-Tg Tox+/−), and Tox−/− thymocytes (results from three experiments are shown).
Figure 2
Figure 2
Complementation of Tox-deficient T cells with ThPOK. A-B, Flow cytometry of total thymocytes from Tox+/+, Tox−/−, ThPOK-Tg Tox+/+ and ThPOK-Tg Tox−/− mice stained for CD5, TCRβ, CD4 and CD8. Numbers indicate percentage of gated populations. Data are representative of four experiments. C, Absolute cell numbers of thymocyte populations from Tox+/+, Tox−/−, ThPOK-Tg Tox+/+ and ThPOK-Tg Tox−/− mice are plotted. Each symbol represents one mouse. Data represent at least four experiments. D, Histogram overlays of surface CD5, TCRβ, and CD69 expression in ThPOK-Tg Tox+/− CD4SP (red) and ThPOK-Tg Tox−/− CD4loSP (blue) thymocytes as gated in (B). Data is representative of four experiments. E, Intracellular staining for GATA3 in DP (black), TCR+CD8SP (blue) and CD4SP or CD4loSP (red) thymocyte subsets as gated in (B). The median fluorescence intensity for the GATA3 antibody signal is indicated for the CD4SP and CD4loSP populations in each mouse strain. Data are representative of four experiments.
Figure 3
Figure 3
Repression of the CD8 gene program by ThPOK is TOX-independent. A, Flow cytometry of total thymocytes from Tox+/+, Tox−/−, ThPOK-Tg Tox+/+ and ThPOK-Tg Tox−/− stained for CD4, CD8 and CD103. Surface expression of CD103 was determined on CD4SP or CD4loSP (red), CD8SP (black) and DD (green) thymocyte subsets. Numbers indicate percentage of gated populations. Data are representative of three experiments. B, Expression of Runx proteins was determined by Western blot in sorted thymocyte lysates and compared to wild-type (WT) CD8+ T cells. Expression of actin was determined and used as a loading control. Data are representative of two experiments. C, Absolute spleen cellularity in Tox+/+, Tox−/−, ThPOK-Tg Tox+/+ and ThPOK-Tg Tox−/− is plotted. Bars represent average values and standard deviations are represented by error bars (n=4). Data are representative of at least four experiments. D, Flow cytometry of total splenocytes stained for expression of TCRβ, CD4 and CD8. Numbers indicate percentage of gated populations. E-G, Average frequencies of TCRβ+ splenocytes (E), as well as the CD4+ and CD8+ subsets within the TCRβ+ subset (F), as gated in (D) are shown (n=4). The frequency of CD4+8int T cells in the spleen is plotted (G) (n=4). *P = 0.011 **P = 0.0008. Error bars represent standard deviations. Data are representative of four experiments. H, Quantitative RT-PCR analysis of Prf1 expression in purified splenic T cells from mice with the indicated genotypes. Results are represented as relative to expression of Gapdh. Two independent experiments are shown, except in the case of wild-type (WT) CD8+ T cells where one experiment is plotted.
Figure 4
Figure 4
Development of the CD4 lineage program and E protein activity are TOX dependent. A-B, Expression of the Cd4 gene was assessed by quantitative real-time RT-PCR in sorted thymocyte populations from Tox−/− mice (A) and ThPOK-Tg mice on a Tox+/− or Tox−/− background (B). C-D, Expression of the endogenous Thpok 3′UTR was assessed by quantitative real-time RT-PCR in sorted thymocyte populations (C) or in enriched CD4+ T splenocytes (D). Results are expressed relative to Gapdh (A-D). Two (B-C) and three (D) independent experiments are plotted. E-G, Expression of the Id2 (E), Id3 (F) and Tesc (G) genes was assessed by quantitative RT-PCR in sorted thymocyte populations from ThPOK-Tg mice on a Tox+/− or a Tox−/− background. Averages of three independent experiments are plotted and error bars show standard deviations (E-F). * P = 0.005 (E). Two independent experiments are plotted (G). Results are expressed relative to Gapdh.
Figure 5
Figure 5
Induction of CD4+ T cell maturation and function is dependent on TOX. A, Quantitative RT-PCR analysis of expression of Foxo1 in purified CD4SP (from ThPOK-Tg Tox+/− mice) or CD4loSP (from ThPOK-Tg Tox−/− mice) thymocytes. Averages of three independent experiments are plotted and error bars show standard deviations. * P = 0.02. B, Western blot showing expression of FOXO1 levels in sorted DP and CD4SP (from ThPOK-Tg Tox+/− mice) or CD4loSP (from ThPOK-Tg Tox−/− mice) thymocytes. C, Quantitation of FOXO1 protein levels from (B), normalized to expression of β-actin in the same samples. Averages of three independent experiments are plotted and error bars show standard deviations. * P = 0.005. D-E, Quantitative RT-PCR analysis of expression of Klf2 (D) and S1pr1 (E) in purified CD4SP (from ThPOK-Tg Tox+/− mice) or CD4loSP (from ThPOK-Tg Tox−/− mice) thymocytes. Averages of three independent experiments are plotted and error bars show standard deviations. * P = 0.007 (D) and *P = 0.02 (E). Results are expressed relative to Gapdh. F-G, Histogram overlays showing expression of CD127, CCR7 and CD62L (F) and cell size as assessed by forward scatter (G) on CD4SP (from ThPOK-Tg Tox+/− mice) (grey) or CD4loSP (from ThPOK-Tg Tox−/− mice) (black) thymocytes. Data are representative of three experiments. H-I, Flow cytometry of expression of CD154 on resting (grey) or ex vivo activated (black) CD4SP (from ThPOK-Tg Tox+/− mice) or CD4loSP (from ThPOK-Tg Tox−/− mice) thymocytes (H) and CD4+ T cells from Tox+/−, Tox−/−, ThPOK-Tg Tox+/− and ThPOK-Tg Tox−/− (I) mice is shown. Data are representative of two experiments. J, Flow cytometry of expression of CD69 on resting (grey) or ex vivo activated (black) CD4+ T cells from ThPOK-Tg Tox+/− and ThPOK-Tg Tox−/− (I) mice is shown. Data are representative of three experiments. K-L, Quantitation of data in (I) and (J), respectively. Black bars represent activated CD4+ cells, while grey bars represent resting CD4+ cells. * P = 1.2x10⁻⁴ (K), * P =6.4x10⁻⁸ (L). M, Expression of Foxo1 was assessed by quantitative RT-PCR in sorted CD4+ T cells from ThPOK-Tg mice on a Tox+/− or a Tox−/− background. Averages of three independent experiments are plotted and error bars show standard deviations. * P = 0.009. N, Flow cytometry for expression of CD44 on CD4+ T from ThPOK-Tg Tox+/− (grey) and ThPOK-Tg Tox−/− (black) mice is shown. Data is representative of four experiments.
Figure 6
Figure 6
Expression of cell survival factor BCL2 fails to rescue CD4+ T cell development in the absence of TOX. A, Thymocytes from mice of the indicated genotype were immunostained for CD4 and CD8 and analyzed by flow cytometry. B, Expression of CD4 and CD8 was analyzed on TCRβsplenocytes. A-B, Numbers indicate frequency (%) of cells in the adjacent gates. Data are representative of two animals.
Figure 7
Figure 7
Small thymic medullary regions form, and contain CD4+SP cells, in ThPOK-Tg Tox−/− mice. A-D, Frozen thymic sections from ThPOK-Tg Tox+/− (A,C) and ThPOK-Tg Tox−/− (B,D) mice, stained for CD4 (green) and CD8 (red). DP cells appear as yellow. Medullary thymic epithelial cells are identified by staining with the lectin Ulex europaeus agglutinin 1 (blue). In (D), the arrows point to examples of CD4SP cells in a medullary region. Original magnification of 20x (A,B) and 63x (C,D). Data are representative of two animals.

References

    1. Collins A, Littman DR, Taniuchi I. RUNX proteins in transcription factor networks that regulate T-cell lineage choice. Nat Rev Immunol. 2009;9:106–115. - PMC - PubMed
    1. Wang L, Bosselut R. CD4-CD8 lineage differentiation: Thpok-ing into the nucleus. J Immunol. 2009;183:2903–2910. - PMC - PubMed
    1. Sakaguchi S, Hombauer M, Bilic I, Naoe Y, Schebesta A, Taniuchi I, Ellmeier W. The zinc-finger protein MAZR is part of the transcription factor network that controls the CD4 versus CD8 lineage fate of double-positive thymocytes. Nat Immunol. 2010;11:442–448. - PMC - PubMed
    1. Taniuchi I, Osato M, Egawa T, Sunshine MJ, Bae SC, Komori T, Ito Y, Littman DR. Differential requirements for Runx proteins in CD4 repression and epigenetic silencing during T lymphocyte development. Cell. 2002;111:621–633. - PubMed
    1. Egawa T, Tillman RE, Naoe Y, Taniuchi I, Littman DR. The role of the Runx transcription factors in thymocyte differentiation and in homeostasis of naive T cells. J. Exp. Med. 2007;204:1945–1957. - PMC - PubMed

Publication types

MeSH terms