. 2012 Jan;23(1):86-102.
doi: 10.1681/ASN.2010111210. Epub 2011 Oct 21.

Toll-like receptor 4 promotes tubular inflammation in diabetic nephropathy

Affiliations

Toll-like receptor 4 promotes tubular inflammation in diabetic nephropathy

Miao Lin et al. J Am Soc Nephrol. 2012 Jan.

Abstract

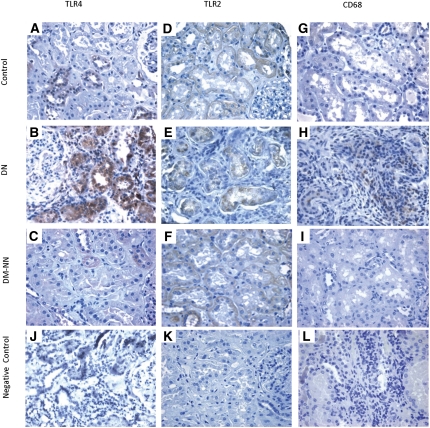
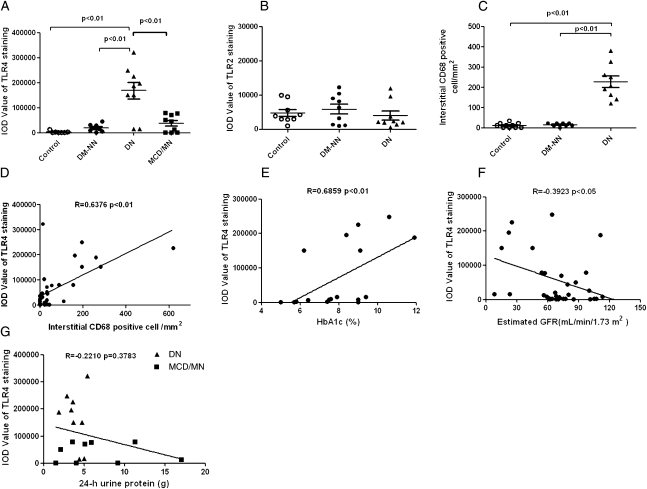
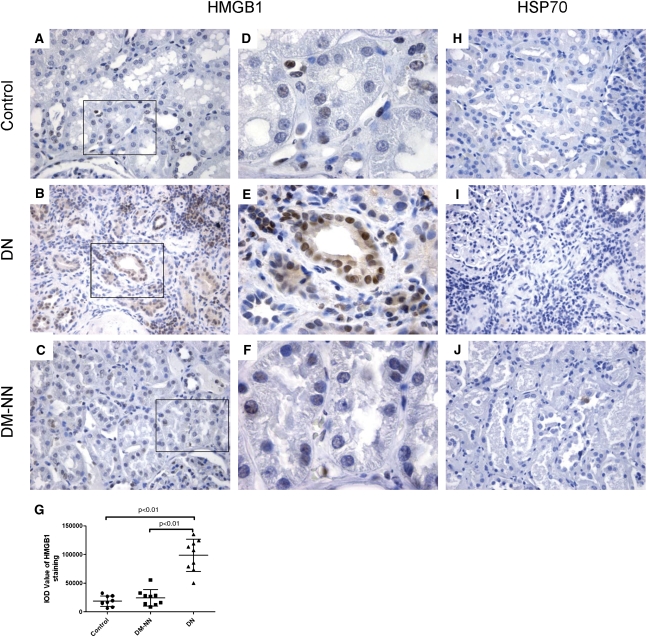
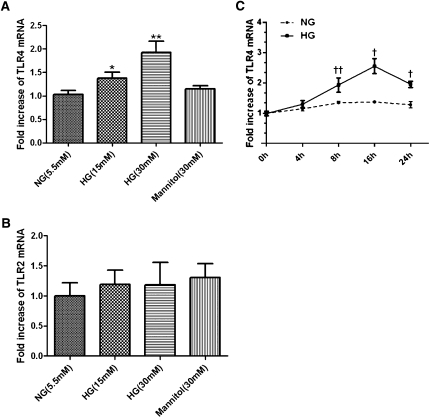
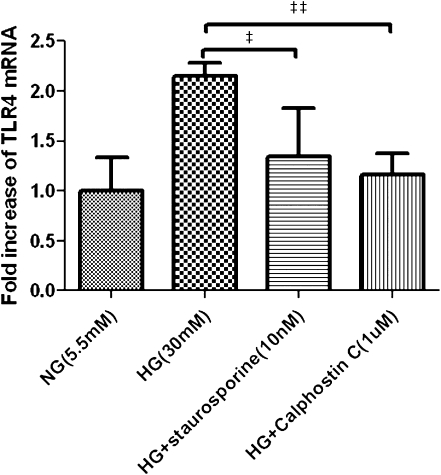
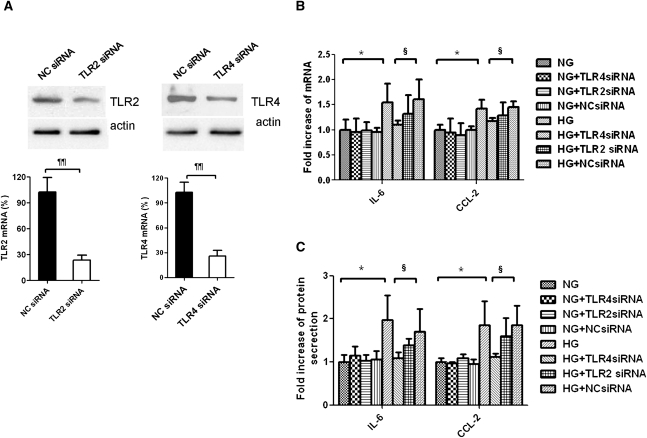
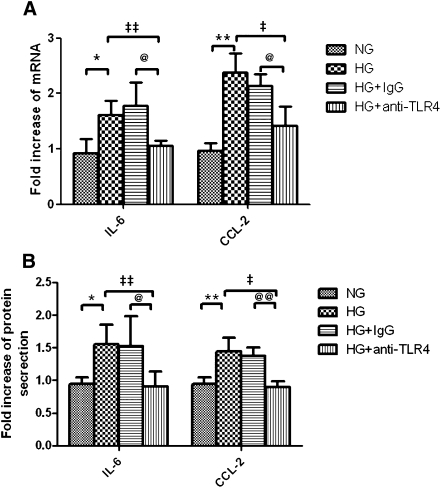
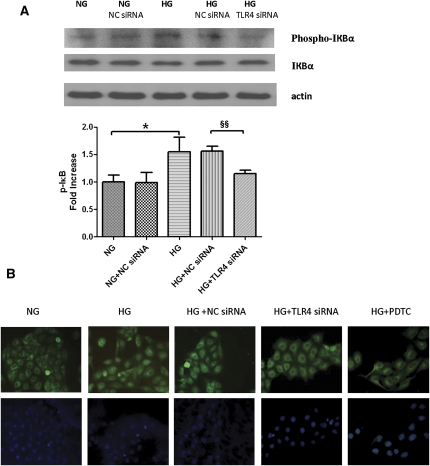
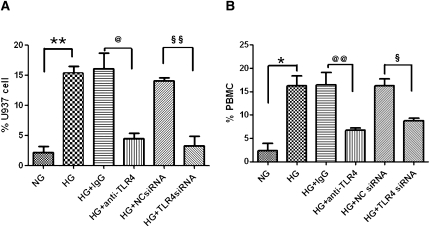
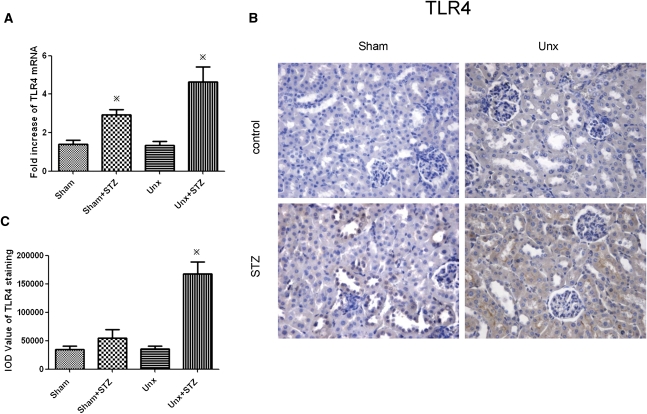
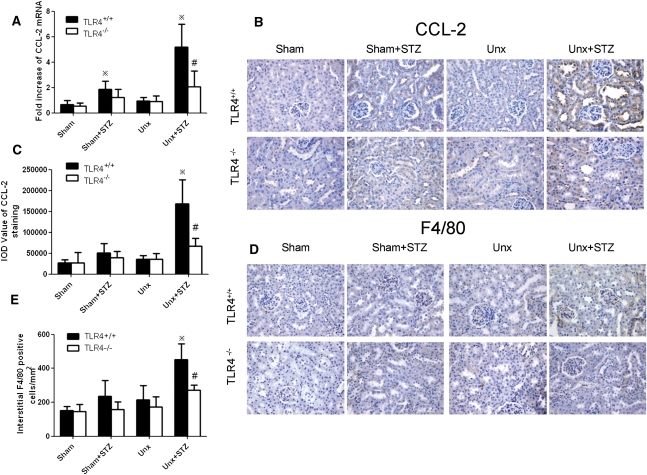
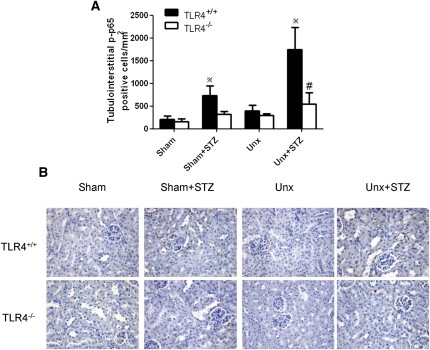
Inflammation contributes to the tubulointerstitial lesions of diabetic nephropathy. Toll-like receptors (TLRs) modulate immune responses and inflammatory diseases, but their role in diabetic nephropathy is not well understood. In this study, we found increased expression of TLR4 but not of TLR2 in the renal tubules of human kidneys with diabetic nephropathy compared with expression of TLR4 and TLR2 in normal kidney and in kidney disease from other causes. The intensity of tubular TLR4 expression correlated directly with interstitial macrophage infiltration and hemoglobin A1c level and inversely with estimated glomerular filtration rate. The tubules also upregulated the endogenous TLR4 ligand high-mobility group box 1 in diabetic nephropathy. In vitro, high glucose induced TLR4 expression via protein kinase C activation in a time- and dose-dependent manner, resulting in upregulation of IL-6 and chemokine (C-C motif) ligand 2 (CCL-2) expression via IκB/NF-κB activation in human proximal tubular epithelial cells. Silencing of TLR4 with small interfering RNA attenuated high glucose-induced IκB/NF-κB activation, inhibited the downstream synthesis of IL-6 and CCL-2, and impaired the ability of conditioned media from high glucose-treated proximal tubule cells to induce transmigration of mononuclear cells. We observed similar effects using a TLR4-neutralizing antibody. Finally, streptozotocin-induced diabetic and uninephrectomized TLR4-deficient mice had significantly less albuminuria, renal dysfunction, renal cortical NF-κB activation, tubular CCL-2 expression, and interstitial macrophage infiltration than wild-type animals. Taken together, these data suggest that a TLR4-mediated pathway may promote tubulointerstitial inflammation in diabetic nephropathy.


Figures

Figure 1.
Figure 1.
Renal cortical expression of TLR4, TLR2, and macrophage infiltration in human kidney biopsies. Representative photomicrographs of TLR4 staining in human renal cortical tissue from normal subjects (A), DN patients (B), and DM-NN patients (C); TLR2 staining in normal subjects (D), DN patients (E), and DM-NN patients (F); and CD68 staining, which denotes infiltrating CD68+ macrophages, in normal subjects (G), DN patients (H), and DM-NN patients (I). Negative control by omission of the corresponding primary antibodies demonstrated no nonspecific staining (J–L). Hematoxylin stain; original magnification, ×400.
Figure 2.
Figure 2.
Quantitative analysis of expression of TLR4 and TLR2 and correlation with CD68+ cell infiltrates in human kidney biopsies. The average IOD of each group was performed by computer-assisted quantitation. (A) TLR4 staining was significantly higher in DN patients (▲; n=9; P<0.01) compared with that in normal controls (○; n=9), DM-NN patients (●; n=9), and MCD/MN patients (▪, n=9). (B) TLR2 staining was similar among DN patients, DM-NN patients, and control subjects (P>0.05). (C) The number of infiltrating CD68+ monocytes/macrophages in the tubulointerstitial area was significantly higher in patients with DN (P<0.01) than in DM-NN patients and normal subjects. (D) Positive correlation between the number of interstitial CD68+ monocytes/macrophages and the intensity of TLR4 staining. (E) Correlation between TLR4 staining and HbA1c in diabetic patients. (F) Negative correlation between TLR4 staining and estimated GFR in all subjects. (G) No correlation between TLR4 staining and 24-hour urine protein excretion among DN and MCD/MN patients.
Figure 3.
Figure 3.
Renal cortical expression of HMGB1 and HSP70 in human biopsies. Representative photomicrographs of HMGB1 staining in human renal cortical tissue from normal subjects (A and D), DN patients (B and E), and DM-NN patients (C and F); HSP70 staining in cortical tissue of normal subjects (H), DN patients (I), and DM-NN patients (J). The average IODs of HMGB1 staining were significantly higher in DN patients than those in normal subjects (P<0.01) and DM-NN patients (P<0.01) (G). Hematoxylin stain; original magnification: ×400 (A–C and H–J); ×1000 (D–F).
Figure 4.
Figure 4.
Effect of high ambient glucose on TLR4 and TLR2 mRNA expression in PTECs. Dose effect of HG on mRNA expression of TLR4 (A) and TLR2 (B). PTECs were incubated with increasing doses of ambient glucose (from 5.5 to 30 mM) for 8 hours. mRNA expression was determined by real-time PCR. *P<0.05, **P<0.01 versus PTECs cultured with normal glucose media. (C) Time effect of HG on mRNA expression of TLR4. PTECs were incubated with high ambient glucose (30 mM) for 0–24 hours. P<0.05, ††P<0.01 versus time zero control. All results represent means ± SD obtained from five independent experiments. NG, normal glucose.
Figure 5.
Figure 5.
Effect of PKC inhibitors on HG-induced TLR4 expression. PTECs were treated for 16 hours with normal glucose (5.5 mM), HG (30 mM), or PKC inhibitors staurosporine (10 nM, added 1 hour before the addition of HG) or calphostin C (1 µM, added 1 hour before addition of HG). Results are means ± SD of three independent experiments. P<0.05, ‡‡P<0.01 versus cells treated with HG alone. NG, normal glucose.
Figure 6.
Figure 6.
Effect of HG on IL-6 and CCL-2 expression in PTECs and the effect of TLR4 knockdown. (A) Efficacy of TLR2 and TLR4 knockdown. PTECs were transfected with 30 nM nonspecific negative control siRNA (NC siRNA), TLR2-specific siRNA, or TLR4-specific siRNA, and the respective mRNA and protein expressions were measured after 24 hours. PTECs with no knockdown, transfected with TLR4 siRNA, TLR2 siRNA, or NC siRNA, were incubated with normal glucose (5.5 mM) or HG (30 mM) for 24 hours. (B) Gene expression of IL-6 and CCL-2 was determined by real-time PCR. (C) Protein synthesis of IL-6 and CCL-2 in culture supernatants was determined by ELISA. All results represent means ± SD obtained from five independent experiments. ¶¶P<0.01 versus PTECs transfected with NC siRNA; *P<0.05 versus PTECs cultured with NG media; §P<0.05 versus PTECs transfected with NC siRNA and cultured with HG medium. NG, normal glucose.
Figure 7.
Figure 7.
Effect of TLR4-neutralizing antibody on HG-induced IL-6 and CCL-2 expression. PTECs were pretreated with TLR4-neutralizing antibody (20 μg/ml) or equivalent dose of IgG control before addition of HG for 24 hours. At the end of incubation, IL-6 and CCL-2 mRNA expression was determined by real-time PCR (A), and their protein levels in culture supernatants were determined by ELISA (B). Results represent means ± SD of three independent experiments. *P < 0.05, **P < 0.01 versus PTECs cultured with NG media; P<0.05, ‡‡P<0.01 versus PTECs cultured with HG media; @P<0.05, @@P<0.01 versus PTECs pretreated with IgG control and cultured with HG media. NG, normal glucose.
Figure 8.
Figure 8.
Effect of TLR4 knockdown on HG-mediated IκB/NF-κB signaling in PTECs. (A) Western blot analysis of IκB phosphorylation. PTECs pretransfected with either TLR4 siRNA or negative control siRNA were treated with HG (30 mM) for 6 hours. The phosphorylation state of IκB was detected by immunoblotting against anti–phospho-IκB antibody. Levels of phosphorylation were normalized to actin. Results are means ± SD obtained from three independent experiments. *P < 0.05, versus PTECs cultured with NG media §§P<0.01 versus PTECs transfected with NC siRNA and cultured with HG media. A representative blot is shown at the top. (B) Study of subcellular translocation of NF-κB by immunofluorescence staining. PTECs with no knockdown, transfected with negative control siRNA or TLR4 siRNA, were incubated with HG (30 mM) for 8 hours and were stained by immunofluorescence for the p65 subunit of NF-κB (green, top panel) and for cell nuclei with 4′,6-diamidino-2-phenylindole (blue, bottom panel). PTECs treated with normal glucose (5.5 mM) and HG plus pyrrolidine dithiocarbamate (PDTC; an NF-κB translocation inhibitor) served as baseline and positive controls, respectively. NC siRNA, negative control siRNA; NG, normal glucose. Original magnification, ×400.
Figure 9.
Figure 9.
Induction of monocyte chemotaxis by HG-activated PTECs and the effect of TLR4 inhibition. Unstimulated monocytic U937 cells (A) and PBMCs (B) were fluorescently labeled with Calcein-AM and seeded onto the upper chamber of a Transwell insert. Conditioned media obtained from PTECs with no knockdown, anti-IgG antibody treatment, TLR4-neutralizing antibody treatment, negative control siRNA transfection, or TLR4 siRNA transfection exposed to HG for 48 hours were added to the lower chamber of the Transwell culture system. After 3 hours, the number of cells that migrated to the lower chamber of the Transwell was determined by spectrofluorometry. Results are presented as a percentage of input cell number. *P < 0.05, **P < 0.01 versus PTECs cultured with NG media; @P<0.05, @@P<0.01 versus PTECs pretreated with IgG control and cultured with HG media; §P<0.05, §§P<0.01 versus PTECs transfected with NC siRNA and cultured with HG media. All results represent means ± SD obtained from three independent experiments. NC siRNA, negative control siRNA; NG, normal glucose.
Figure 10.
Figure 10.
Renal cortical expression of TLR4 in diabetic and nondiabetic TLR4+/+ mice. (A) TLR4 mRNA expression, determined by real-time PCR, in renal cortex 12 weeks after STZ induction. (B) Representative photomicrograph of renal cortical immunostaining for TLR4. Hematoxylin stain; original magnification, ×400. (C) Quantitative analysis of tubular TLR4 staining. Data represent means ± SD for groups of eight animals. *P<0.05 versus the corresponding nondiabetic animals.
Figure 11.
Figure 11.
Renal cortical CCL-2 expression and macrophage infiltration in diabetic and nondiabetic TLR4−/− and wild-type mice with or without Unx. (A) Renal cortical CCL-2 mRNA expression determined by real-time PCR. (B) Representative photomicrograph of immunohistochemical staining for CCL-2. Hematoxylin stain; original magnification, ×400. (C) Quantitative analysis of tubular CCL-2 staining. (D) Representative renal cortical sections of F4/80 immunostaining. Hematoxylin stain; original magnification, ×400. (E) Number of interstitial F4/80+ cells. *P<0.05 versus the corresponding nondiabetic animals; #P<0.05 for comparison between diabetic Unx-TLR4+/+ and Unx-TLR4−/− mice.
Figure 12.
Figure 12.
Renal cortical phosphorylated NF-κB/p65 nuclear staining in diabetic and nondiabetic TLR4−/− and wild-type mice with or without Unx. (A) Quantitative analysis of phosphorylated NF-κB/p65 nuclear staining in tubulointerstitium. *P<0.05 versus the corresponding nondiabetic animals; #P<0.05 for comparison between diabetic Unx-TLR4+/+ and Unx-TLR4−/− mice. (B) Representative renal cortical immunostaining for nuclear phosphorylated NF-κB/p65. Hematoxylin stain; original magnification, ×400. Data represent means ± SD for groups of eight animals.

References

    1. Zimmet P, Alberti KG, Shaw J: Global and societal implications of the diabetes epidemic. Nature 414: 782–787, 2001 - PubMed
    1. Navarro-González JF, Mora-Fernández C: The role of inflammatory cytokines in diabetic nephropathy. J Am Soc Nephrol 19: 433–442, 2008 - PubMed
    1. Taft JL, Nolan CJ, Yeung SP, Hewitson TD, Martin FI: Clinical and histological correlations of decline in renal function in diabetic patients with proteinuria. Diabetes 43: 1046–1051, 1994 - PubMed
    1. Mackenzie HS, Ziai F, Omer SA, Nadim MK, Taal MW: Angiotensin receptor blockers in chronic renal disease: the promise of a bright clinical future. J Am Soc Nephrol 10[Suppl 12]: S283–S286, 1999 - PubMed
    1. The GISEN Group (Gruppo Italiano di Studi Epidemiologici in Nefrologia): Randomised placebo-controlled trial of effect of ramipril on decline in glomerular filtration rate and risk of terminal renal failure in proteinuric, non-diabetic nephropathy. Lancet 349: 1857–1863, 1997 - PubMed

Publication types

MeSH terms